In recent years, amplicon sequencing technology has emerged as a critical tool for studying microbiomes, oncology, and genetics. By performing high-throughput sequencing of specific genetic regions, researchers can unravel the structure, functions, and dynamic changes of microbial communities from complex samples. In amplicon sequencing data analysis, the amplicon sequence variant (ASV) table is one of the core data outputs, providing a detailed overview of sequence variations and serving as a pivotal foundation for subsequent bioinformatics analyses.
Currently, mainstream analytical pipelines, such as QIIME 2 and DADA2, excel at generating ASV tables. However, there is still room for improvement in areas such as data processing, functional annotation, and cross-platform integration. This article explores the construction and applications of amplicons, highlighting the latest advancements and future directions in this field.
What is Amplicon Sequence Variants
Amplicon Sequence Variants (ASVs) have become a widely adopted high-resolution technique in microbiome research. In contrast to conventional Operational Taxonomic Unit (OTU)-based methods, ASVs detect sequence variations at a single-nucleotide level, enabling enhanced precision and reliability. When analyzing 16S rRNA, 18S rRNA, or ITS amplicon data, ASV feature tables offer detailed insights into the microbial composition and abundance of samples. This makes them a powerful tool for examining diversity, predicting functional roles, and advancing ecological studies.
Service you may intersted in
Resource
Amplicon Sequence Variants vs OTUs
ASVs and OTUs are both methods used to analyze microbial communities based on sequencing data, but they differ in their approach. OTUs group sequences based on a predefined similarity threshold, typically 97% identity, which can lead to the loss of resolution. In contrast, ASVs identify sequence variations at a single-nucleotide level. The selection of ASV or OTU for analyzing amplicon sequencing data depends on the research objectives, experimental design, and sample characteristics.
Construction of Amplicon Sequence Variant Table
1. Data Acquisition
The construction of an ASV feature table begins with high-quality amplicon sequencing data. Commonly used platforms include Illumina MiSeq and HiSeq, whose paired-end sequencing capabilities can fully cover hypervariable regions such as the V3-V4 or V4-V5 regions of the 16S rRNA gene. Choosing the appropriate sequencing platform and target region is critical for ensuring downstream analysis accuracy.
2. Data Preprocessing
Data preprocessing is foundational to ASV feature table construction and involves the following steps:
- Removal of Low-Quality Sequences: Use quality control tools (e.g., FastQC) to assess the quality of raw sequences. Identifying and eliminating compromised genetic sequences is crucial, particularly those characterized by an abundance of ambiguous nucleotides, suboptimal base quality metrics, or insufficient fragment lengths. Trimming and filtering can be accomplished through robust computational tools such as Trimmomatic and Cutadapt.
- Removal of Adapter and Primer Sequences: Amplicon datasets frequently harbor primer or adapter contamination, which potentially introduces significant analytical complications. Computational approaches, including Cutadapt and specialized data processing libraries, enable effective removal of these extraneous genetic elements.
- Removal of Host DNA: Genomic samples often contain host-derived DNA from organisms like humans, animals, or plants, which can compromise research specificity. Comprehensive decontamination protocols involve alignment techniques that systematically identify and exclude sequences matching the host genome, ensuring precise and targeted genetic analysis.
3. Sequence Denoising
Denoising is the core step of the ASV approach. Unlike OTU clustering, denoising algorithms distinguish sequence variants at single-nucleotide resolution. Common tools include:
- DADA2: Uses a probabilistic model to correct sequencing errors and generate error-free ASVs. Before performing the DADA2 processing, ensure that the sequencing data meets the following three conditions: First, the samples should be split into separate.fastq files; second, non-biological sequences, such as primers and adapters, should be removed. If not, trimming commands can be used to remove these sequences from both ends of the reads; and third, for paired-end sequencing, the forward and reverse.fastq files should contain matching sequences.
- Deblur: Applies a fixed distribution model for efficient processing of short-read sequences.
4. ASV Feature Table Generation
Denoised sequences are used to construct an ASV feature table, typically represented as a matrix where rows correspond to ASVs, columns represent samples, and cell values indicate ASV abundance in each sample. Normalization and filtering of low-abundance ASVs may be applied to reduce noise.
Table 1. The generated ASV table
| SampleID |
AGCTGACTGACG |
GCTAGCTGACTG |
AGCTAGGCTAGC |
TCGATCGATGCT |
ATCGATCGTAGC |
| Sample_001 |
0 |
0 |
0 |
15 |
5 |
| Sample_002 |
12 |
0 |
19 |
0 |
0 |
| Sample_003 |
0 |
9 |
0 |
12 |
7 |
| Sample_004 |
0 |
2 |
0 |
10 |
0 |
| Sample_005 |
9 |
0 |
22 |
11 |
8 |
Applications of ASV Feature Tables
1. Microbial Community Diversity Analysis
ASV feature tables enable robust α and β diversity analyses:
- α Diversity: Focuses on measuring species richness and evenness within individual samples. Common indices used to quantify α diversity include Chao1, which estimates the total species richness, and the Shannon index, which accounts for both abundance and evenness of species..
- β Diversity: Assesses community composition differences between samples, often visualized through techniques like Principal Coordinates Analysis (PCoA) or Non-metric Multidimensional Scaling (NMDS).
Functional Prediction
By integrating ASV feature tables with functional prediction tools such as PICRUSt2, researchers can estimate the functional capabilities of microbial communities. For example, a study exploring gut microbiota utilized PICRUSt2 to predict metabolic pathways linked to microbial taxa identified in ASV tables. This analysis highlighted associations between specific ASVs and increased carbohydrate metabolism, offering potential insights into dietary strategies that could enhance gut health (Wu, Y., et al., 2021).
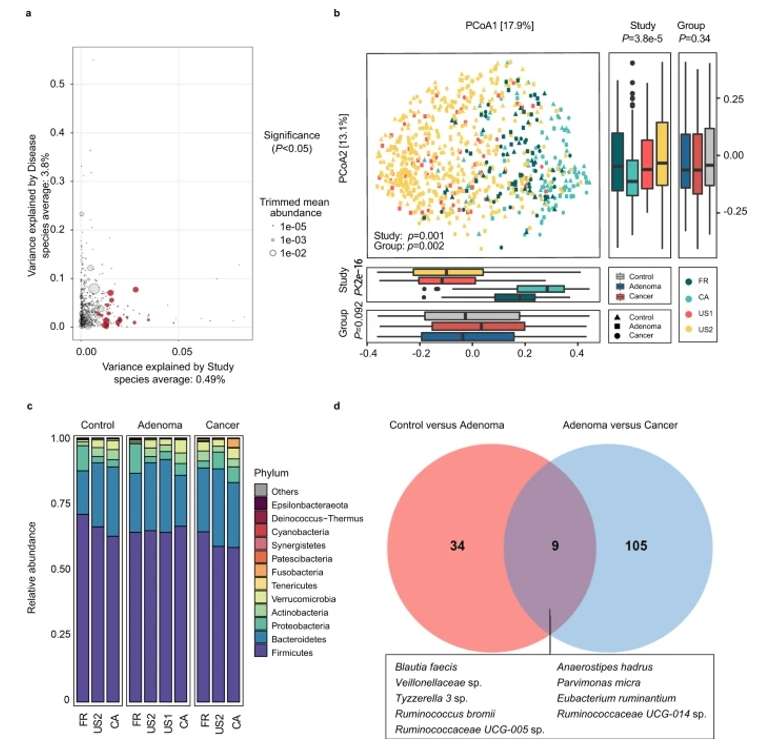 Fig. 1. Alterations of gut microbial composition in different disease status.(Wu, Y., et.al, 2021).
3.Biomarker Discovery for Diseases
ASVs' high resolution facilitates the identification of disease-associated microbial biomarkers.A notable example is the discovery of specific ASVs in colorectal cancer patients that were significantly enriched compared to healthy controls. In this case, ASVs assigned to C. scindens and Blautia sp. were identified as potential biomarkers for early detection of colorectal cancer, showcasing how ASV feature tables can be instrumental in clinical diagnostics(Wu, Y., et.al, 2021).
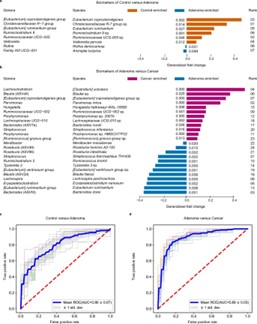 Fig. 2. Performance of discriminating adenoma from control or cancer using important features.(Wu, Y., et.al, 2021).
4.Environmental Ecology Studies
ASV feature tables are extensively applied in studying microbial communities in soil, water, and air. A comprehensive analysis of freshwater ecosystems revealed that ASV-based assessments could detect changes in microbial diversity due to pollution levels. Researchers found that specific ASVs were indicators of water quality, providing valuable insights for environmental monitoring and conservation efforts(Townsend, A., et.al, 2023).
Advantages of the ASV Approach
- High Resolution: The ASV approach provides high-resolution data by distinguishing sequence variants at a single-nucleotide level. This capability is crucial for accurately identifying microbial species.
- Reproducibility: ASV methods enhance reproducibility in microbial studies by producing results that are consistent and independent of subjective clustering thresholds.
- Database Integration: The ability to directly align ASVs with reference databases like SILVA and Greengenes enhances classification accuracy.
Tools and Resources
1. Amplicon sequence variants dada2
DADA2(Divisive Amplicon Denoising Algorithm 2) is an open-source software package designed to model and correct sequencing errors from various sequencing platforms (Illumina, Roche 454) in amplicon data. In amplicon analysis workflows, the DADA2 algorithm accurately infers sample sequences and identifies single-nucleotide variations, often detecting more true variants and generating fewer erroneous sequences than other methods. DADA2 operates by constructing an error rate model to infer whether an amplicon sequence originates from the template, using an error model based on the data itself, without relying on external distribution models. The key advantage of DADA2 lies in its use of more data, as the error model incorporates quality information, whereas other methods ignore this information after filtering low-quality sequences. Furthermore, DADA2's error model accounts for quantitative abundance and calculates the probabilities of various sequence variants.
Other tools
QIIME2(Quantitative Insights Into Microbial Ecology 2) is an open-source software suite designed for microbiome analysis. It provides a range of tools and workflows for processing and analyzing microbiome data.
PICRUSt2: A tool for functional predictions based on ASV tables.
2. Reference Databases
SILVA: Supports taxonomic annotation of 16S/18S rRNA sequences.
Greengenes: Provides classification information for bacteria and archaea.
UNITE: Specializes in fungal ITS sequence annotation.
3. Open Data Resources
Researchers can access 16S rRNA amplicon data from platforms like NCBI, EMBL-EBI, or MG-RAST for learning or testing ASV workflows.
Future Directions
- Integration with Long-read Sequencing: Combining ASV methods with PacBio or Nanopore sequencing will enhance sequence accuracy and facilitate whole-genome analyses.
- Multi-omics Integration: Merging ASV data with transcriptomics, metabolomics, and other datasets to uncover complex ecological and functional networks.
- Development of Efficient Algorithms: Creating faster algorithms to support the large-scale construction and analysis of ASV feature tables.
Conclusion
As a high-resolution analytical method, ASV feature tables have demonstrated remarkable potential in microbiome research. Whether for uncovering community diversity, predicting functional capabilities, or identifying disease biomarkers, ASV approaches offer unique perspectives and data support. With advancements in sequencing technology and computational tools, the applications and research depth of ASV feature tables will continue to expand, driving innovation in microbial ecology and medical research.
References:
- Wu, Y., Jiao, N., Zhu, R. et al. Identification of microbial markers across populations in early detection of colorectal cancer. Nat Commun 12, 3063 (2021). https://doi.org/10.1038/s41467-021-23265-y
- Townsend, A., den Bakker, H. C. et al. (2023). 16S microbiome analysis of microbial communities in distribution centers handling fresh produce. Frontiers in microbiology, 14, 1041936. https://doi.org/10.3389/fmicb.2023.1041936

 Sample Submission Guidelines

