Introduction
The preservation of biodiversity is crucial to uphold the resilience and operational integrity of ecosystems. Through the analysis of species richness across varied environments, researchers are able to gauge the well-being and fluctuations of ecological systems. Central to the study of biodiversity is the concept of Beta diversity, which facilitates the comparison of differences in species composition among communities or different ecosystems. It is a key metric frequently used in microbiome studies to analyze differences in microbial community structures across various environments.The objective of this paper is to explore Beta diversity in depth, emphasizing its importance and discussing the techniques used for its quantification.
What is Beta Diversity?
Definition
Beta diversity refers to the difference in species composition between ecosystems. It quantifies how species diversity changes from one habitat to another, providing insights into the spatial patterns of biodiversity(Whittaker,et.al,1960).
Beta Diversity vs. Alpha and Gamma Diversity
Alpha Diversity, Beta Diversity, and Gamma Diversity each have unique meanings and applications. Below are their definitions and a comparative overview:
| Diversity Type |
Definition |
Measurement Scope |
Representative Metrics |
| Alpha Diversity |
Measures species diversity within a single ecosystem, including species richness and evenness. |
Single ecosystem |
Shannon Index, Simpson Index |
| Beta Diversity |
Evaluates differences in species composition between ecosystems, reflecting species turnover and ecosystem variation. |
Comparison between multiple ecosystems |
Jaccard Index, Bray-Curtis Index |
| Gamma Diversity |
Represents the total species diversity across multiple ecosystems, integrating local and regional biodiversity. |
Total across multiple ecosystems |
Total species count |
Service you may intersted in
How to Calculate Beta Diversity
In the analysis of community data, Beta diversity is often quantified by Ecological resemblance. Ecological similarity is based on the calculation of community composition similarity or distance between quadrats, which is one of the basic methods for processing multivariate ecological data. For example, in the analysis of species data, if two communities share the same species and the abundance of all species is consistent, then the two communities have the highest degree of similarity (or the lowest distance of 0).
Similarity indices
Intuitively, the more similar two objects are in each attribute, the more similar they are. For community data, these attributes are typically species composition, or environmental attributes. For example, using species composition data, community similarity based on similarity indices ranges from 0 (two communities do not share any species) to 1 (two communities have exactly the same species type and abundance).
Jaccard Index
The Jaccard index is a straightforward similarity metric used to measure the similarity or dissimilarity of species composition between two communities. It is based on the presence of species within the communities (ignoring species abundance) and is calculated using the formula:
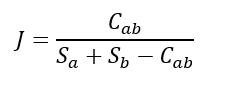
Here, Cab represents the number of species shared by both communities, while Sa and Sb denote the number of species unique to community A and community B, respectively. The J ranges from 0 to 1, with lower values indicating greater differences between the communities.
All similarity indices can be converted into distance indices, commonly used transformation formulas:
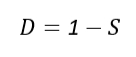
Where S is the similarity index and D is the distance index.
However, not all distance indices can be converted into similarity indices, such as Euclidean distance.
Distance indices
The distance index is divided into two main categories, one is species distance (e.g. Jaccard, Bray-Curtis,Euclidean distance), and the other is evolutionarily based distance (Unifrac).
Bray-Curtis Index
The Bray-Curtis index is a similarity measure that takes into account species abundance and is one of the most commonly used distances for calculating microbial abundance differences. Its formula is as follows:
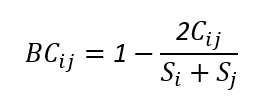
Cij: Compare the abundances of each species in the two samples and sum the relatively low abundances of all species.
Si+Sj: The sum of the abundances of all species in the two samples
The Bray-Curtis distance ranges from 0 to 1, The smaller the BC value, the higher the similarity between the two samples and the smaller the difference.
Euclidean distance
Euclidean distance is a distance often used in multivariate analysis and is calculated as follows:
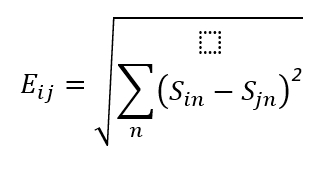
n: The n-th species in the sample.
Sin: The abundance of the n-th species in sample i
Sjn: The abundance of the n-th species in sample j
The magnitude of the Euclidean distance depends on the input abundance values, and its range is
[0,+∞]. A larger Euclidean distance indicates a greater difference between the two samples.
Methods for Analyzing Beta Diversity
Several analytical methods enable researchers to visualize and interpret Beta diversity effectively:
1.Ordination Analysis
Principal Component Analysis (PCA): PCA is a method for dimensionality reduction, where a set of variables is transformed into another set through orthogonal transformations. In a PCA scatter plot, closely clustered points indicate high similarity between samples, while scattered points suggest low similarity. When samples from the same group cluster together, it indicates good repetition and similarity within the group, while clear separation between groups suggests good distinction. To illustrate intra-group similarity, an ellipse may enclose the points of the same group. PCA helps visually assess sample features and cluster samples, revealing their correlations and differences.
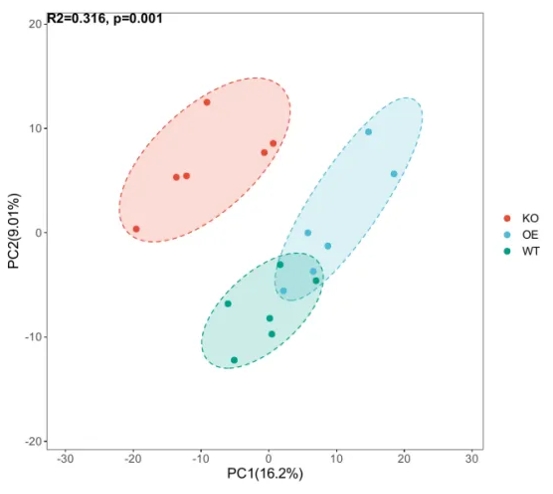 Figure 1.PCA scatter plot illustrating sample similarity and group differences.
Principal Coordinates Analysis (PCoA): PCoA is a visualization method for studying data similarity or dissimilarity. It ranks data based on a series of eigenvalues and eigenvectors, selecting the most significant ones. PCoA allows observation of differences between individuals or groups. Unlike PCA, which is based on Euclidean distance, PCoA uses other distance metrics to identify the principal components that influence differences in sample community composition.
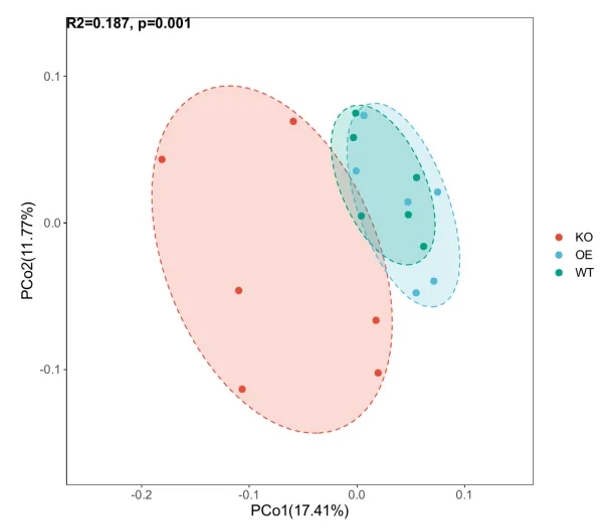 Figure 2. PCoA scatter plot illustrating sample similarity and group differences.
Non-Metric Multidimensional Scaling (NMDS): NMDS is a data analysis method that simplifies high-dimensional objects (samples or variables) into a lower-dimensional space for visualization, analysis, and classification, while preserving the original relationships between objects. It is used when exact similarity or dissimilarity data is unavailable, relying instead on rank-order relationships. NMDS represents sample differences based on the distances between points in multidimensional space. It is more accurate than PCA and PCoA when dealing with large sample sizes.
2. Clustering Analysis
UPGMA (Unweighted Pair Group Method with Arithmetic Mean): Groups similar communities hierarchically based on their Beta diversity.
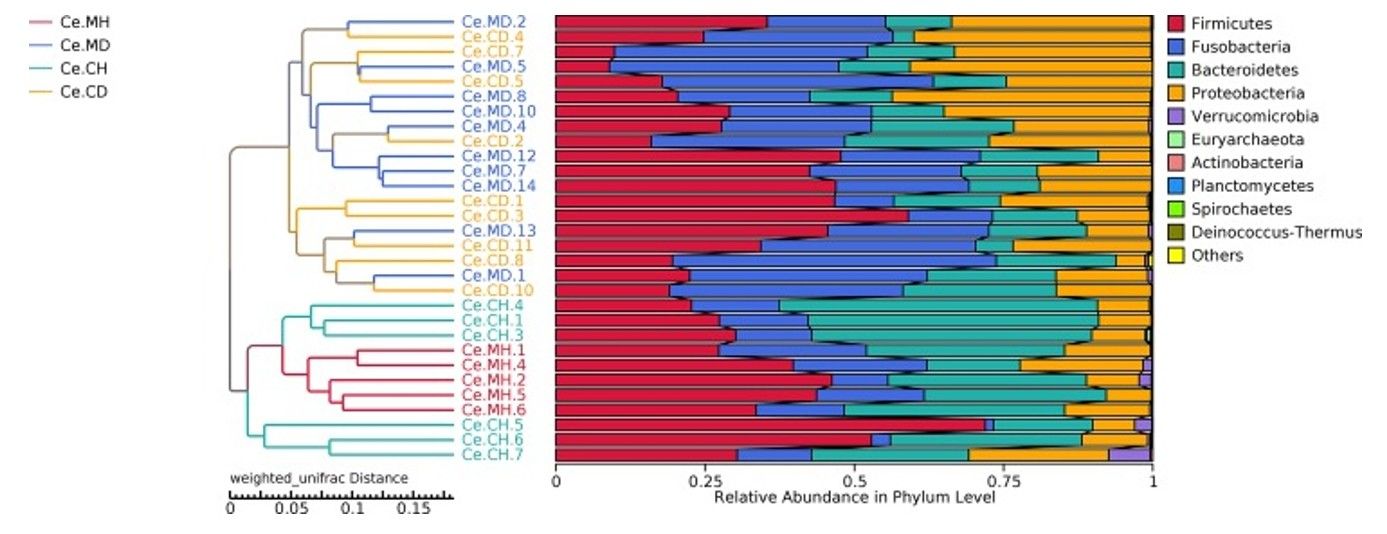 Figure 3.Unweighted pair-group method with UPGMA phylogenetic tree. (Tan, Z.et.al,2019)
3. Statistical Tests for Differences
Adonis (PERMANOVA): Assesses the statistical significance of differences in community composition.
Anosim: Tests whether two or more groups are significantly different.
Applications of Beta Diversity
Ecological Research
Beta diversity helps identify:
- Patterns of species distribution across landscapes.
- Drivers of biodiversity, such as environmental factors and human activities.
For instance, using techniques like 16S/18S/ITS amplicon sequencing, researchers can analyze microbial Beta diversity in soil or water samples.
Biodiversity Conservation
Beta diversity has practical implications for:
- Prioritizing conservation efforts: Identifying regions with high turnover rates.
- Resource management: Guiding strategies for ecosystem restoration.
Advanced tools like metagenomic shotgun sequencing and metatranscriptomic sequencing are instrumental in such studies.
Conclusion
Beta diversity is a cornerstone of biodiversity research, offering critical insights into species distribution and ecosystem health. Its applications in ecological studies and conservation strategies make it invaluable for addressing global environmental challenges.
References:
- Whittaker, R. H. (1960). Vegetation of the Siskiyou Mountains, Oregon and California. Ecological Monographs, 30(3), 279–338. https://doi.org/10.2307/1943563
- Bray, J. R., & Curtis, J. T. (1957). An Ordination of the Upland Forest Communities of Southern Wisconsin. Ecological Monographs, 27(4), 325–349. https://doi.org/10.2307/1942268
- Jolliffe, I. T., & Cadima, J. (2016). Principal component analysis: A review and recent developments. Philosophical Transactions of the Royal Society A: Mathematical, Physical and Engineering Sciences, 374(2065), 20150202. https://doi.org/10.1098/rsta.2015.0202
- Hefner, R. (1959). Warren S. Torgerson, Theory and Methods of Scaling. New York: John Wiley and Sons, Inc., 1958. Pp. 460. Behavioral Science, 4(3), 245–247. https://doi.org/10.1002/bs.3830040308
- Kenkel, N. C., & Orloci, L. (1986). Applying Metric and Nonmetric Multidimensional Scaling to Ecological Studies: Some New Results. Ecology, 67(4), 919–928. https://doi.org/10.2307/1939814
- Tan, Z., Dong, W., et.al. (2019). Changes in cecal microbiota community of suckling piglets infected with porcine epidemic diarrhea virus. PloS one, 14(7), e0219868. https://doi.org/10.1371/journal.pone.0219868

 Sample Submission Guidelines


