Introduction
Ecosystem health hinges on biodiversity, with alpha diversity emerging as a critical analytical tool. This fundamental ecological measure evaluates species composition within a defined spatial context, assessing both the number and distribution of organisms inhabiting a particular environment.
Alongside beta diversity and gamma diversity indices, alpha diversity provides researchers with crucial insights into ecological complexity, revealing the intricate interactions and relative abundance of species in specific habitats. Its applications span multiple scientific domains, from ecological research to microbiome studies, offering a nuanced understanding of biological systems' structural and functional characteristics.
What Is Alpha Diversity?
Definition
Alpha diversity (α-diversity), first defined by ecologist R.H. Whittaker, measures the variation of species within a particular ecosystem. This index assesses both species richness and evenness, offering a view into the structural complexity of biological communities by considering the quantity and distribution of species in a specific habitat. By analyzing how organisms interact and are spatially distributed, alpha diversity sheds light on the complex dynamics of ecological relationships and the influence of environmental factors.
Why It Matters
Alpha diversity provides critical insights into ecosystem health. High alpha diversity indicates robust ecosystems capable of adapting to environmental changes, while low diversity may signal vulnerability.
Service you may intersted in
How to Calculate Alpha Diversity
Alpha diversity is primarily assessed using metrics such as the Chao1 richness estimator, the Shannon diversity index, and the Simpson diversity index.
| Metric |
Description |
Strengths |
| Species Richness(Chao1, ACE, Good's coverage) |
Counts the number of species present |
Simple and intuitive |
| Shannon Index |
Considers abundance and evenness |
Reflects overall community structure |
| Simpson Index |
Emphasizes dominant species |
Useful for comparing communities |
| PD-whole tree |
Considers Richness and Phylogenetic Distance |
The greater the value, the higher the community diversity |
Several indices measure alpha diversity, each with unique advantages:
Species Richness
Species richness is the simplest metric, counting the number of species present in a sample. For example, in a garden with 10 different plant species, the species richness is 10. However, if another garden has only 3 species, even if it has a larger total number of plants, its richness is lower. This straightforward approach provides a baseline understanding of biodiversity within an ecosystem.
The simplest metric, counting the number of species present.
- Chao1:This index estimates the total species richness by accounting for unseen species based on observed data. For instance, if a researcher identifies 15 species in a forest but suspects that there are more hidden due to sampling limitations (like rare species), Chao1 might estimate the total to be around 20.Its calculation formula is:
Sobs is the number of observed species.
n1 is the number of species that appear only once (Singletons).
n2 is the number of species that appear twice (Doubletons).
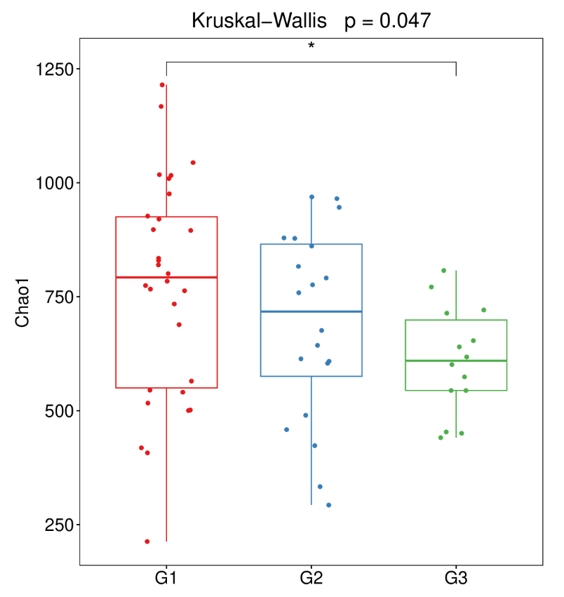 Figure 1.Chao1 index show the species richness in boxplot.
- ACE (Abundance-based Coverage Estimator): Similar to Chao1, ACE focuses on both common and rare species. If an ecological study finds that 12 species are common (observed more than 10 times) and 8 are rare (observed less than 10 times), ACE can provide insights into how many additional rare species might still be present but unobserved.Its calculation formula is:
Scommon is the number of species that appear more than 10 times.
Srare is the number of species that appear 10 times or fewer.
where F1 is the number of Singletons,and N is the total number of OTUs in the sample.
- Good's coverage:This metric assesses how well the sampling captures the diversity of a community. For example, if out of 100 total individuals sampled, 90 are from singleton species (species observed only once), Good's Coverage would indicate low diversity coverage, suggesting that further sampling is necessary to capture more of the community's richness.
Shannon Index
The Shannon Index accounts for both species abundance and evenness. It provides a more nuanced view of diversity by considering how evenly individuals are distributed among different species. For example, in a coral reef where one species dominates but several others exist in lower numbers, the Shannon Index will reflect lower diversity compared to a reef with many species having similar abundances. If Reef A has 80% of its individuals as one coral type and Reef B has equal representation among five types, Reef B will have a higher Shannon Index value. Its calculation formula is:
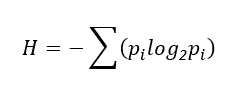
pi is the proportion of individuals belonging to species i, calculated as the number of individuals of that species divided by the total number of individuals.
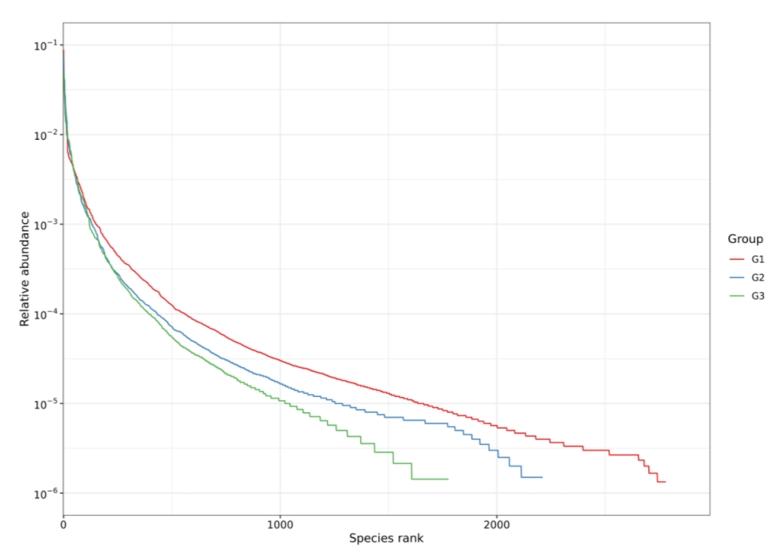 Figure 2.Rank abundance curve.
Simpson Index
The Simpson Index focuses on dominant species and their impact on the ecosystem. It calculates the probability that two randomly selected individuals belong to the same species. In a grassland where one grass type makes up 70% of the biomass and others are sparse, the Simpson Index will yield a low diversity score due to this dominance. Conversely, in a mixed forest where no single tree type dominates, the Simpson Index will indicate higher diversity.Its calculation formula is:
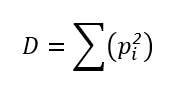
pi is the proportion of individuals belonging to species i in the sample.The final Simpson diversity index is often expressed as 1-D, where a higher value indicates greater diversity.
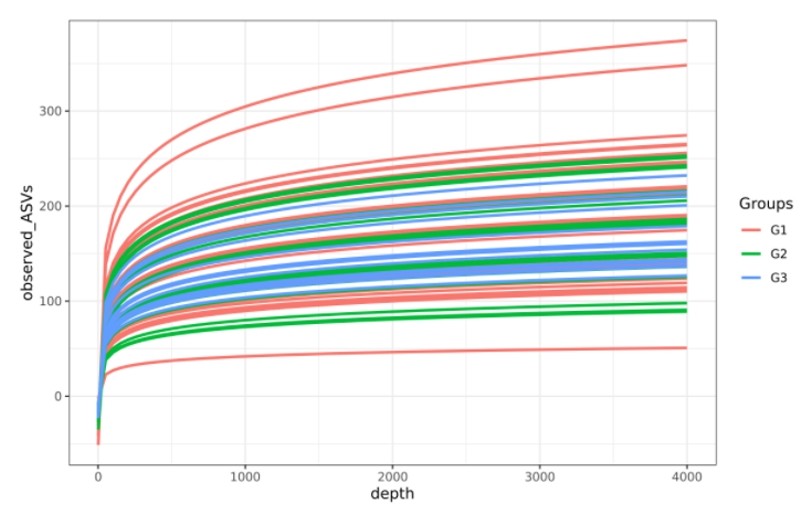 Figure 3.Rarefaction curve.
Applications of Alpha Diversity
In Ecology
- Ecosystem Health: The relationship between high alpha diversity and ecosystem resilience is well-documented. For instance, the Amazon rainforest is noted for its high plant species diversity, which supports various animal species and maintains ecological balance, contributing to nutrient cycling and climate regulation
- Conservation Efforts: Biodiversity metrics have been crucial in conservation strategies, such as in the Cape Floristic Region of South Africa, where high alpha diversity of endemic plant species has led to targeted conservation efforts to preserve unique habitats(Damien R,et.al,2024).
In Microbiome Research
- Human Health: Research indicates that a diverse gut microbiome is linked to better metabolic health. For example, rural populations in Africa exhibit higher gut microbiome diversity and lower obesity rates compared to urban populations in developed countries(Williams, C.et.al,2024).
- Environmental Studies: Evaluating microbial communities in agricultural soils has shown that higher microbial diversity correlates with improved soil health and fertility. Studies comparing organic and conventional farms reveal that organic farms typically have higher microbial diversity, leading to better crop yields(Reese, A.et.al,2018).
Conclusion
Alpha diversity is foundational for understanding biodiversity and its role in ecosystem resilience and functionality. Advances in genomic technologies, such as those offered by CD Genomics, have revolutionized the measurement and analysis of alpha diversity. To learn more about biodiversity research and its applications, explore our 16S/18S/ITS Amplicon Sequencing, Metagenomic Shotgun Sequencing, and Viral Metagenomic Sequencing services.
References:
- Chao, A. 1984. Nonparametric Estimation of the Number of Classes in a Population. Scan. J. Statist. 11: 265–270. https://www.jstor.org/stable/4615964
- Chao, Anne, and Shen-Ming Lee. Estimating the Number of Classes via Sample Coverage.”Journal of the American Statistical Association, vol. 87, no. 417, 1992, pp. 210–17. JSTOR, https://doi.org/10.2307/2290471.
- SIMPSON, E. Measurement of Diversity. Nature 163, 688 (1949). https://doi.org/10.1038/163688a0
- Damien R Finn, A metagenomic alpha-diversity index for microbial functional biodiversity, FEMS Microbiology Ecology, Volume 100, Issue 3, March 2024, fiae019, https://doi.org/10.1093/femsec/fiae019
- Williams, C. E., Hammer, T. J., & Williams, C. L. (2024). Diversity alone does not reliably indicate the healthiness of an animal microbiome. The ISME journal, 18(1), wrae133. https://doi.org/10.1093/ismejo/wrae133
- Reese, A. T., & Dunn, R. R. (2018). Drivers of Microbiome Biodiversity: A Review of General Rules, Feces, and Ignorance. mBio, 9(4), e01294-18. https://doi.org/10.1128/mBio.01294-18

 Sample Submission Guidelines