I. Introduction
DNA methylation plays a critical role in gene regulation, disease mechanisms, and biomarker discovery. Methylation array technology provides a high-throughput method to quantitatively analyze specific methylation sites, aiding in understanding gene expression regulation and disease mechanisms. However, the complexity of methylation data requires precise technical strategies for preprocessing, quality control, normalization, differential analysis, and downstream functional analysis to ensure reliable results, especially for large-scale datasets.
Methylation array data analysis faces several challenges:
- Probe design differences and dynamic ranges may introduce biases affecting accuracy.
- Issues such as batch effects, probe contamination, and signal noise in preprocessing can distort results.
- Selecting appropriate algorithms and tools tailored to research goals remains complex. For instance, various statistical models (e.g., Bayesian methods, wavelet-based models) differ in their ability to detect differentially methylated regions.
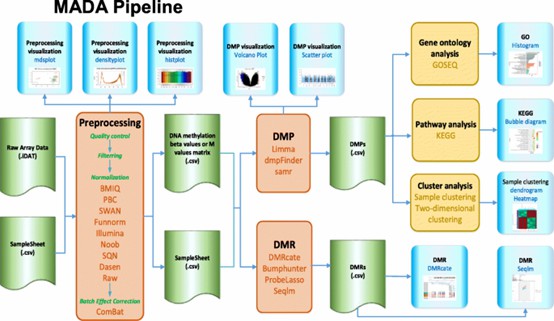 MADA Pipeline. It includes four stages: Pre-processing (Quality controls, Filtering, Normalization, batch effect correction), DMPs, DMRs and downstream analysis. The visualization of Pre-processing, DMP, DMR, and downstream analysis are also provided. (Hu, et al., 2020)
This article aims to offer practical techniques to optimize methylation array data analysis, including:
- Data preprocessing: Using standardization (e.g., subset quantile normalization) and quality control (e.g., p-value filtering) to minimize biases.
- Differential analysis: Employing statistical models like BMIQ for probe bias correction and visualizing results with tools like MADA.
- Downstream analysis: Applying gene ontology, pathway analysis, and clustering to interpret methylation changes.
- Tool selection: Recommending R, Bioconductor packages, and MADA for streamlined data analysis and visualization.
Service you may interested in
Want to know more about the details of DNA Methylation Arrays? Check out these articles:
II. Overview of DNA Methylation Array Data Analysis
The analysis of DNA methylation array data involves multiple steps and diverse tools, where the process from data import to result interpretation necessitates an integrated approach considering chip design, data preprocessing, statistical analysis, and biological interpretation. The judicious selection and application of these tools and methodologies can substantially enhance research efficiency and result reliability.
1. Fundamental Principles of DNA Methylation Array Data Analysis
DNA methylation represents a pivotal epigenetic modification extensively involved in regulating gene expression, disease onset, and cellular differentiation processes. DNA methylation array technology stands as a high-throughput analytical method, facilitating quantitative assessments of specific genomic regions. This methodology encompasses several integral steps:
- Sample Processing and DNA Extraction: Initially, DNA is extracted from samples, followed by chemical or enzymatic modification or labeling of the DNA.
- Chip Hybridization: The processed DNA fragments undergo hybridization with probes on the array, where hybridization signal intensity reflects methylation levels of the targeted regions.
- Data Capture and Signal Detection: Utilizing microarray technology, hybridization signals are captured and signal intensities are measured with scanning devices, such as the Illumina HiScan instrument.
- Data Preprocessing and Analysis: The captured data undergo a series of processes, including quality control, normalization, noise reduction, and differential analysis to identify variations in methylation levels.
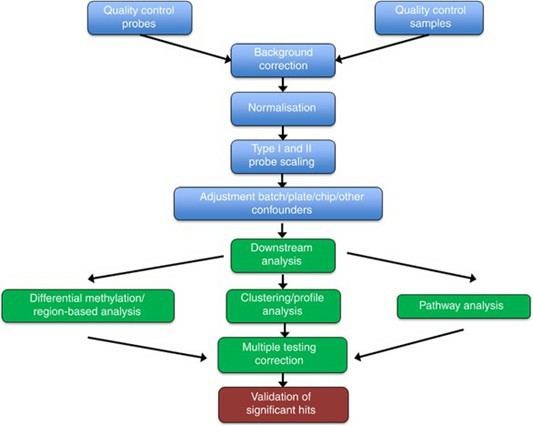 Methylation array data processing and analysis pipeline. (Wilhelm-Benartzi, C., et al. 2013)
2. Commonly Used Analytical Tools and Software
Illumina Methylation Analyzer
The Illumina Methylation Analyzer serves as a dedicated software package designed specifically for analyzing data from the Illumina Infinium HumanMethylation450 BeadChip. It offers a comprehensive workflow from data import to result output, encompassing functions like data preprocessing, quality control, normalization, and differential analysis.
Other Bioinformatics Tools
- Minfi: A Bioconductor package focusing on preprocessing and quality assessment of Infinium methylation chip data, supporting various normalization methods.
- ChAMP: Integrates multiple analytical tools, including batch correction and functional enrichment analysis.
- RnBeads: Provides an exhaustive data processing pipeline, including data loading, normalization, and differential analysis.
- limma: Utilized for linear model analysis of microarray data, particularly suited for differential expression analysis.
- methylR: A graphical interface tool supporting data analysis on Infinium and EPIC chips.
- FastDMA: A multi-core parallel computing tool for rapid analysis of Infinium chip data.
- MADA: A web-based tool integrating data quality control, nine normalization methods, and statistical analysis of differentially methylated regions (DMRs).
Integrated Platforms
- Beeline Software: Reduces the size of experimental data to facilitate large-scale data analysis.
- DRMScaler: Employed to identify DMRs.
- Gene Expression Omnibus (GEO): A platform for storing and sharing gene expression data.
3. Key Steps in the Data Analysis Workflow
The workflow for analyzing DNA methylation array data typically includes the following key steps:
(1) Data Import and Quality Control
- Importing raw data files (e.g., in .idat format).
- Conducting quality control to assess sample variability and chip performance.
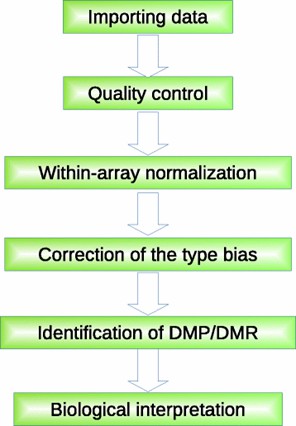 A generalized framework of Illumina 450K array data analysis. (Wang, et al., 2018)
(2) Data Preprocessing
- Normalization: Utilizing methods such as Subset-Quantile Normalization (SQN) to correct inter-chip biases.
- Noise Reduction: Removing background noise and other confounding factors.
- Probe Filtering: Eliminating low-quality probes or those with high cross-reactivity.
(3) Differential Analysis
- Employing linear mixed models (e.g., limma package) to calculate probe β-values and differential expression statistics.
- Identifying significantly differentially methylated positions (DMPs) and further analyzing regional DMRs.
(4) Visualization and Functional Annotation
- Utilizing visualization tools like volcano plots and heatmaps to display changes in methylation levels.
- Conducting Gene Ontology (GO) analysis and pathway enrichment analysis to explore the biological significance of methylation changes.
(5) Advanced Analysis
- Integrative Multi-Omics Analysis: Combining methylation data with other omics data (e.g., transcriptomics, proteomics) to uncover complex biological mechanisms.
- Dynamic Changes in Specific Regions: Investigating methylation trends over time through time-series analysis.
III. Tips for Preprocessing Methylation Array Data
Data preprocessing serves as the foundational step in data analysis and modeling, encompassing data cleansing, transformation, and scaling. By identifying and removing outliers, applying normalization techniques, and selecting appropriate transformation methods, data quality and analytical efficiency can be significantly improved. These steps not only bolster model performance but also ensure the reliability and accuracy of analytical results.
Quality Control and Data Cleansing
- Identification and Removal of Outliers: Data cleansing is a critical step in data preprocessing, aimed at ensuring data accuracy and consistency. A central task within this process is the identification and removal of outliers. Outliers are values that significantly deviate from other data points and may arise due to measurement errors, data entry mistakes, or extreme scenarios. Common methods for detecting outliers include statistical techniques such as the Z-score, which identifies these anomalies and allows for their removal or replacement as necessary.
- Normalization Techniques: Normalization is a data standardization method designed to scale data to a specified range (such as between 0 and 1), effectively eliminating dimensional discrepancies among different features. This step is crucial for many machine learning algorithms, as some (like gradient descent) are sensitive to feature scaling. Common normalization techniques include Min-Max Scaling and Z-score Standardization (or mean normalization). These methods ensure that all features are compared on the same scale, thereby enhancing model performance.
Data Transformation and Scaling
- Beta Values and M-values: In gene expression data analysis, transforming data can enhance analysis efficacy. Beta values and M-values are two prevalent transformation methods:
1. Beta Values: Computed by dividing the raw signal intensity by the background intensity, beta values are used to mitigate the impact of background noise.
2. M-values: Resulting from logarithmic transformation, M-values express the log ratio of signal intensities, effectively handling extreme values and uneven distributions. The choice between these methods depends on the specific data type and analytical requirements.
- Selecting Appropriate Transformation Methods: Data transformation is another pivotal aspect of data preprocessing, aimed at improving data distribution characteristics to suit subsequent analyses. Common transformation methods include:
1. Logarithmic Transformation: Suitable for data with positive skewness, it improves data distribution and minimizes the influence of extreme values.
2. Square Root Transformation: Applies to data where variance increases with the mean, balancing differences among various features.
3. Standardization and Normalization: Standardization is often employed to align data with a standard normal distribution, while normalization scales data to a specific range. The choice of method depends on the target model's requirements and the inherent characteristics of the data.
IV. Enhancing Interpretation of Methylation Array Data
By integrating statistical analysis techniques with visualization tools, researchers can enhance the interpretation of genomic data, thereby unraveling the complex relationships between methylation patterns and gene expression and their biological significance.
Statistical Analysis Techniques
1. Differential Methylation Analysis: Differential Methylation Analysis (DMA) is a pivotal method for examining alterations in genomic methylation patterns. It employs statistical models to identify methylation sites exhibiting significant changes across different samples or conditions. For instance, the 'limma' package in R is commonly used for RNA-seq and microarray differential expression analyses and can be extended to methylation data analysis. Additionally, other statistical approaches, such as Pearson correlation and sparse Canonical Correlation Analysis (sCCA), can be employed to explore the relationship between gene expression and methylation.
2. Correlation Analysis of Gene Expression Data: A close relationship exists between DNA methylation and gene expression, warranting combined analyses of methylation and gene expression data as a standard strategy. By calculating the Pearson correlation coefficient, one can assess the relationship between the methylation level and expression level of specific genes. Advanced methods, such as the Interpolated Curve Model, may uncover non-linear associations between methylation patterns and gene expression.
Visualization Techniques
1. Heatmaps and Volcano Plots: Heatmaps and volcano plots are prevalent visualization tools utilized in gene expression analysis to illustrate changes in expression levels and the significance of differentially expressed genes (DEGs). Heatmaps visually display expression trends through color-coded intensity, while volcano plots depict statistical significance and fold-changes with the X-axis representing negative log P-values and the Y-axis representing fold change. Tools like the 'methylR' package offer functionalities to generate these plots, facilitating an intuitive understanding of methylation data.
2. Integration with Genomic Annotation Tools: To further elucidate the functional context of differentially expressed genes, heatmaps and volcano plots can be integrated with GO or pathway analysis. For example, using tools such as ReactomePA or KEGG-GSEA, one can perform enrichment analyses on differentially expressed genes, unveiling their roles in biological processes. Graphical interface tools like TCGAbiolinksGUI also support combining volcano plots with pathway analysis results for comprehensive visualization.
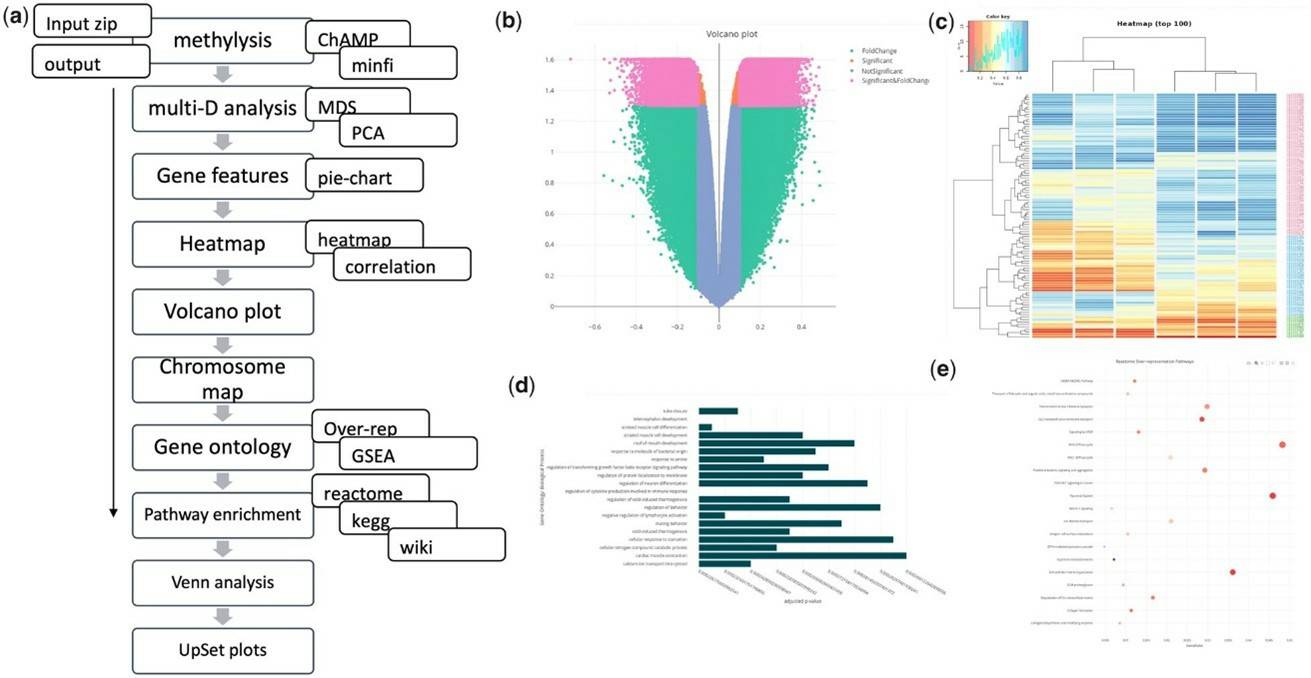 methylR Pipeline Schematic and Analysis Result Visualization. (Volpe, et al. (2023)
V. Tips for Optimizing Methylation Array Data Analysis
By clearly defining research goals, judiciously selecting analytical tools and parameters, utilizing public databases, and partnering with experts, researchers can significantly improve the efficiency and accuracy of their data analyses. These strategies are not only pertinent to the field of bioinformatics but are also applicable to other research areas that involve complex data processing.
Selecting Appropriate Analytical Frameworks
1. Aligning Analytical Tools with Research Questions: In the realm of data analysis, it is paramount to clearly define research objectives and specific questions. This precision aids researchers in selecting suitable analytical methods and tools, thereby ensuring the accuracy and efficacy of the analysis outcomes. Depending on the nature of the research question, methods such as descriptive statistics, regression analysis, and cluster analysis can be chosen, with considerations given to data type (continuous or categorical) and scale. Engaging with pertinent literature and consulting with peers can further enlighten researchers on the most fitting tools or pipelines for particular research needs.
2. Customizing Analytical Parameters: The careful adjustment of parameters during data analysis is crucial for ensuring the reliability of results. For instance, in model training, researchers can enhance model performance through hyperparameter tuning, selecting appropriate feature engineering methods, or trying different algorithms. Furthermore, selecting suitable statistical analysis methods (such as regression analysis or time series analysis) based on the data distribution and characteristics can markedly improve analytical effectiveness.
Leveraging Bioinformatics Resources
1. Public Databases and Repositories: Public databases and repositories serve as foundational resources for bioinformatics research by offering extensive, high-quality datasets. Researchers can access genomic data, protein sequence data, and more, often provided in machine-readable formats with comprehensive metadata. Integrating data from diverse sources can enhance the comprehensiveness and precision of analyses.
2. Collaboration with Bioinformatics Experts: Experts in bioinformatics possess a wealth of experience and specialized knowledge that can offer valuable technical support and advice. They can assist researchers in selecting suitable analytical tools, optimizing data processing workflows, and addressing complex data challenges. Interdisciplinary collaboration—melding fields such as computer science with biology—can also result in innovative solutions.
VI. Common Pitfalls and Strategies in Methylation Array Data Analysis
A. Overfitting and Underfitting in Statistical Models
1. Overfitting: Overfitting occurs when a model is excessively complex, capturing noise or random fluctuations in the training data instead of the underlying patterns. This issue leads to poor generalization performance on new, unseen data. For instance, a model that performs exceptionally well on a training dataset might falter on validation or test datasets due to its excessive sensitivity to noise.
- Causes of Overfitting:
- An excessive number of parameters relative to the available data
- High variance in model predictions
- Insufficient regularization or premature stopping during training
- Techniques to Mitigate Overfitting:
- Regularization: Implement techniques such as L1 or L2 regularization to penalize large coefficients and reduce model complexity.
- Cross-Validation: Employ methods like k-fold cross-validation to ensure robust model generalization across different data subsets.
- Early Stopping: Monitor validation set performance and halt training when it plateaus or degrades.
- Feature Selection: Diminish the number of input features by removing irrelevant or redundant variables.
- Data Augmentation: Enhance the training dataset size through synthetic data generation to mitigate overfitting.
2. Underfitting: Underfitting occurs when a model is too simplistic to adequately represent the data's underlying patterns, leading to high bias and suboptimal performance on both training and unseen data.
- Causes of Underfitting:
- Insufficient model complexity to capture data structure
- Too few features or parameters relative to data complexity
- Inappropriate model specification (e.g., using linear models for non-linear relationships)
- Techniques to Prevent Underfitting:
- Increase Model Complexity: Employ more sophisticated models, such as polynomial regression or neural networks, to capture complex relationships.
- Add More Features: Integrate additional relevant features to enrich the model's understanding of the data.
- Hyperparameter Tuning: Optimize hyperparameters through techniques like grid search or random search to identify the best model configuration.
- Ensemble Methods: Leverage multiple models to enhance overall performance and robustness.
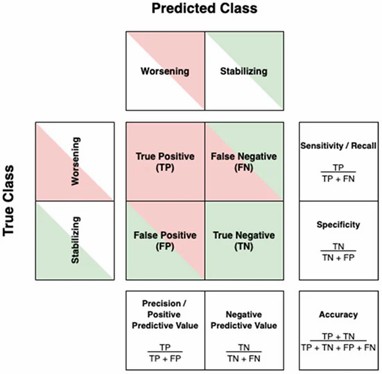 The confusion matrix and its derived metrics. (Denissen, Stijn, et al. 2021)
B. Misinterpretation of Results
Misinterpretation often stems from incorrect assumptions about statistical tests, disregarding bias, or failing to differentiate between practical and statistical significance.
- Common Misinterpretations:
- Confusing p-values with practical significance
- Overlooking bias introduced by missing data or outliers
- Misapplying statistical tests or neglecting test assumptions
- Overemphasizing significance without considering effect size or variability
- Strategies to Avoid Misinterpretation:
- Careful Statistical Planning: Ensure that statistical tests align with research questions and data characteristics.
- Transparency: Clearly document methods, assumptions, and limitations to aid reproducibility and interpretation.
- Collaboration: Consult with subject matter experts to validate interpretations and ensure relevance.
- Interpretation Guidelines: Adhere to established guidelines for interpreting statistical results, such as considering confidence intervals and effect sizes alongside p-values.
C. Ensuring Reproducibility and Validation
Reproducibility and validation are essential to ensure that statistical modeling results are reliable and generalizable across datasets and contexts.
- Challenges in Reproducibility:
- Insufficient transparency in documenting methods, data sources, and assumptions
- Incomplete or biased data leading to inconsistent results
- Complexity in models impairing generalizability and reproducibility on new data
- Strategies to Ensure Reproducibility:
- Documentation: Keep detailed logs of all data preparation, modeling, and analysis steps.
- Data Sharing: Disseminate datasets publicly or with collaborators for independent verification.
- Validation Techniques: Employ cross-validation and out-of-sample testing to assess model performance on unseen data.
- Robust Preprocessing: Implement thorough preprocessing steps for managing missing values, outliers, and biases.
- Collaborative Validation: Engage with other researchers or stakeholders to validate findings through independent analysis or replication studies.
By acknowledging these common pitfalls and employing strategies to circumvent them, researchers can enhance the reliability, validity, and generalizability of their statistical models.
VII. Conclusion
Optimizing methylation array data analysis necessitates a multifaceted approach. Primarily, data preprocessing is crucial, encompassing fluorescence intensity transformation, imputation of missing values, and data normalization, all aimed at ensuring data integrity. The choice of deconvolution methods is pivotal; researchers should select appropriate supervised, unsupervised, or hybrid approaches based on their specific needs. Furthermore, integrating gene expression with methylation data can enhance the precision of diagnostic models, and the application of machine learning and deep learning techniques can further augment data analysis efficacy. Specialized bioinformatics tools additionally simplify the analytical workflow, thereby enhancing the reliability of results.
In the bioinformatics sphere, continuous learning and adaptation to new technologies are imperative. Interdisciplinary collaboration facilitates a deeper understanding of data, while the integration of practice and theory enables the ongoing validation of hypotheses and optimization of analytical methods. Ultimately, the enhancement of data quality, the practical applicability of results, and the ongoing refinement of analytical processes are key to elevating the effectiveness of data analysis. Sharing research experiences and findings can propel the field forward and offer valuable insights for fellow researchers.
References:
- Hu, X., Tang, L., Wang, L. et al. MADA: a web service for analysing DNA methylation array data. BMC Bioinformatics 21 (Suppl 6), 403 (2020). https://doi.org/10.1186/s12859-020-03734-9
- Gorrie-Stone, Tyler J., et al. "Bigmelon: tools for analysing large DNA methylation datasets." Bioinformatics 35.6 (2019): 981-986. https://doi.org/10.1093/bioinformatics/bty713
- Pidsley, R., Y Wong, C.C., Volta, M. et al. A data-driven approach to preprocessing Illumina 450K methylation array data. BMC Genomics 14, 293 (2013). https://doi.org/10.1186/1471-2164-14-293
- Wilhelm-Benartzi, C., Koestler, D., Karagas, M. et al. Review of processing and analysis methods for DNA methylation array data. Br J Cancer 109, 1394–1402 (2013). https://doi.org/10.1038/bjc.2013.496
- Volpe, Massimiliano, and Jyotirmoy Das. "methylR: a graphical interface for comprehensive DNA methylation array data analysis." Bioinformatics 39.4 (2023): btad184. https://doi.org/10.1093/bioinformatics/btad184
- Wang, Z., Wu, X. & Wang, Y. A framework for analyzing DNA methylation data from Illumina Infinium HumanMethylation450 BeadChip. BMC Bioinformatics 19 (Suppl 5), 115 (2018). https://doi.org/10.1186/s12859-018-2096-3
- Fan, Cheng, et al. "A review on data preprocessing techniques toward efficient and reliable knowledge discovery from building operational data." Frontiers in energy research 9 (2021): 652801. https://doi.org/10.3389/fenrg.2021.652801
- Rauluseviciute, I., Drabløs, F. & Rye, M.B. DNA methylation data by sequencing: experimental approaches and recommendations for tools and pipelines for data analysis. Clin Epigenet 11, 193 (2019). https://doi.org/10.1186/s13148-019-0795-x
- Lobentanzer, S., Aloy, P., Baumbach, J. et al. Democratizing knowledge representation with BioCypher. Nat Biotechnol 41, 1056–1059 (2023). https://doi.org/10.1038/s41587-023-01848-y
- Denissen, Stijn, et al. "Towards multimodal machine learning prediction of individual cognitive evolution in multiple sclerosis." Journal of Personalized Medicine 11.12 (2021): 1349. https://doi.org/10.3390/jpm11121349
- Angriman, Eugenio, et al. "Guidelines for experimental algorithmics: A case study in network analysis." Algorithms 12.7 (2019): 127. https://doi.org/10.3390/a12070127

 Sample Submission Guidelines

