Homologous Sequencing (Iso-Seq) is a single molecule real-time (SMRT) sequencing technology developed by PacBio, which can generate full-length transcript sequences, thus avoiding the complicated transcriptome reconstruction step in traditional transcriptome sequencing. By directly sequencing the 5' and 3' untranslated regions and polyadenylation tails of cDNA, this technique can completely capture full-length transcripts, including splicing isomers, alternative splicing, alternative polyadenylation (APA), gene fusion events and long noncoding RNA (lncRNA).
Overview of Iso-Seq analysis
The workflow of Iso-Seq technology includes preparing cDNA from RNA samples, transforming it into a library suitable for sequencing, and then sequencing it by using Sequel or Seeq II platform. After sequencing, the data were analyzed by special bioinformatics tools, such as FLNC reading segment extraction, error correction, alignment and homology identification. These tools can generate high-quality transcript sequences and support a variety of downstream analysis, such as gene annotation, differential expression analysis, splicing event detection and gene function prediction.
Iso-Seq technology has shown a wide range of application potential in plant, animal and human research. For example, in the field of plants, it is used to reveal the regulation mechanism of gene expression, epigenetic regulation network and transcriptome complexity. In medical research, it helps to identify disease-related gene mutations and splicing abnormalities. In addition, Iso-Seq can also detect low abundance or rare transcripts, which is often difficult to achieve in RNA-seq.
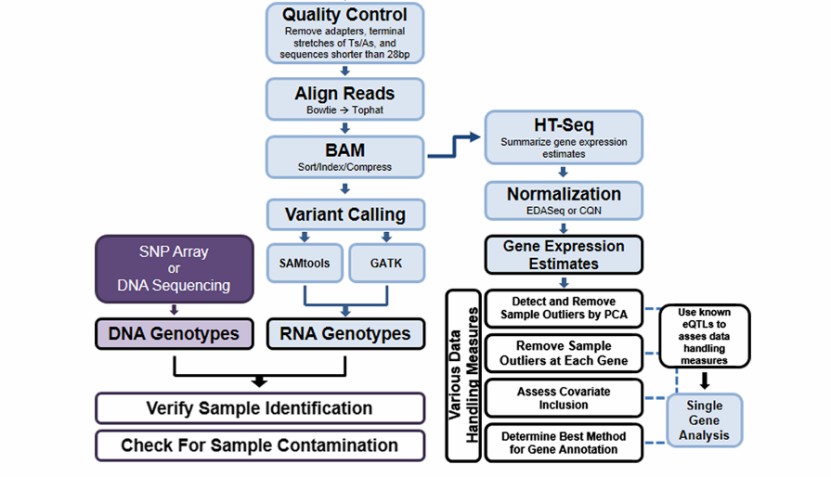 Data analysis workflow for analysis of Iso-Seq data (Shannon et al., 2013)
Importance of mastering data interpretation in Iso-Seq
It is very important for researchers to master the ability of Iso-Seq data analysis for the following reasons:
Improve the accuracy of data: Interpretation Iso-Seq data usually contain rich biological information, but its complexity requires researchers to have strong data analysis ability. For example, the accuracy of transcription annotation can be significantly improved by correctly handling FLNC reading segments, removing errors and comparing them. In addition, choosing appropriate analysis tools (such as PRAPI, TAGET, etc.) for different research problems can further improve the reliability of the results.
Revealing the complexity of transcriptome: Iso-Seq can detect transcript isomers and splicing events that are difficult to find in traditional RNA-seq. For example, it can detect long non-coding RNA, alternative splicing and gene fusion events. Therefore, mastering the data analysis process is helpful to fully understand the gene expression regulation mechanism and transcriptome diversity.
Support multi-omics integration analysis: Iso-Seq data can be combined with other omics data (such as protein omics, epigenetics, etc.) to provide more comprehensive biological insights. For example, by integrating Iso-Seq data with gene expression data, gene function and disease correlation can be predicted more accurately.
Optimizing experimental design: A deep understanding of the data analysis process can help researchers optimize the experimental design. For example, by adjusting sequencing depth and library construction strategy, data quality can be maximized and resource waste can be reduced.
Promote interdisciplinary cooperation: Iso-Seq data analysis involves a variety of bioinformatics tools and technologies, which requires researchers to have interdisciplinary knowledge background. For example, researchers need to understand statistical principles, bioinformatics algorithms and experimental design principles in order to efficiently complete data analysis and explain the results.
Services you may interested in
Want to know more about the details of Iso-seq? Check out these articles:
Data Generation in Iso-Seq
Iso-seq data generation process is complex and rigorous. The first is sample preparation, which needs to extract high-quality total RNA from specific tissues, cells or biological samples, and the integrity and purity of RNA should be high, so as not to affect the subsequent sequencing.
Sample Preparation
RNA extraction and quality control: RNA extraction usually uses standard methods, such as Easy-Spin Plant RNA Extraction Kit or Qiagen RNeasy Mini Kit, to ensure the integrity and purity of RNA. RNA integrity (RIN value) usually requires ≥7.0. The extracted RNA needs to undergo quality assessment, including concentration and integrity testing, such as analysis with NanoDrop or Agilent Fragment Analyser. The total RNA usually needs ≥200 ng to meet the needs of subsequent amplification.
cDNA synthesis and library construction: Clontech SMARTer PCR cDNA synthesis kit was used to synthesize the first strand cDNA. The kit supports the generation of full-length cDNA from total RNA or polyA+ RNA, and the minimum starting amount is 2 ng total RNA or 1 ng polyA+ RNA. SMARTScribe reverse transcriptase will synthesize the complementary strand of cDNA from the end of polyA, and add additional adenine nucleotides when the mRNA reaches the 5' end, thus providing a universal 3' sequence for the second strand synthesis. The second strand cDNA was amplified by KAPA HiFi DNA polymerase. In the process of library construction, we can choose the method of no size selection or size selection.
Sequencing operation
PacBio sequencing workflow: After the preparation of the library, the cDNA library is transformed into an SMRTbell template suitable for sequencing by using PacBio SMRTbell template preparation kit (such as Template Prep Kit 2.0). The template library was loaded into PacBio Sequel II or Sequel IIe sequencing platform by P6 or P7 chemical kit for sequencing. The sequencing time is usually 6 hours, but the specific time depends on the target coverage depth and sample complexity. The data generated in the sequencing process include cyclic consensus sequence (CCS) and acyclic consensus sequence (FLCC), in which CCS is used to generate high-quality full-length transcripts, while FLCC is used to detect low-quality or incompletely amplified sequences.
Data output format: PacBio sequencing data is usually output in BAM format, including original reading data, filtered valid reading and annotation information. After data processing, various output files can be generated, including:
- Original read data: contains the original signal data of all sequencing events.
- Effective reading after filtering: remove low-quality or repeated sequence reading data.
- Annotation information: including the 5' and 3' ends of the transcript, intron and exon boundaries and other information.
Iso-Seq Data Analysis Pipeline
Iso-seq data analysis uses special algorithms and tools to process the long reading and long sequence data obtained by sequencing, so as to realize full-length recognition of transcripts, alternative splicing analysis, gene fusion detection, discovery of new transcripts and quantification of gene expression level, thus comprehensively and deeply analyzing the complexity and diversity of transcriptome.
Pretreatment and quality control
Raw data filtering: Before the subsequent analysis, the original RNA-seq data needs to be evaluated and filtered first. This includes removing low-quality read segments, unclassified read segments, and adapter sequences. Commonly used tools include FastQC, Trimmomatic, etc. These tools can detect pollution, base error rate and over-expressed sequences in samples. Specifically, FastQC is used to preliminarily evaluate the quality of reading segments and generate quality reports to help users understand the reading characteristics of each sample.
Error correction and quality evaluation: For high-quality long reading data, such as data from Iso-Seq technology, further error correction and quality evaluation are needed. For example, reading segments can be pruned by using HTSeq tool to reduce the error rate and improve the accuracy of subsequent analysis. In addition, the quality of the read segment can also be evaluated by indicators such as Q value (q = log10(p × N)), where n is the length of the read segment.
Transcriptome reconstruction and isomer recognition
Iso-Seq analysis tools and software Iso-Seq data analysis usually requires special tools and software.
- Trinity: used for transcriptome reconstruction, which can process long reading segments from Iso-Seq data and identify candidate coding regions.
- HTSeq: used for differential expression analysis, supporting multiple data formats and providing rich statistical functions.
- Kallisto and Sleuth: Used for rapid estimation of gene expression and differential expression analysis.
- RSEM: used for transcription reconstruction and expression estimation based on reference genome.
- In addition, there are other tools such as SAMtools, BWA, and so on, which are used for reading segment comparison and variation detection.
Annotation and comparison with reference genome: After the transcriptome reconstruction, it is necessary to compare the reconstructed transcript with the reference genome. This step is usually done using comparison tools such as SAMtools or BWA. After alignment, tools such as Trinity and HTSeq can be used to further analyze the transcripts, including identifying isomers, estimating expression levels and detecting splicing events. For the identification of isomers, we can also use methods such as Isoform Two-Step Analysis (I2A) to study the gene expression difference by comparing the isomer abundance of different samples.
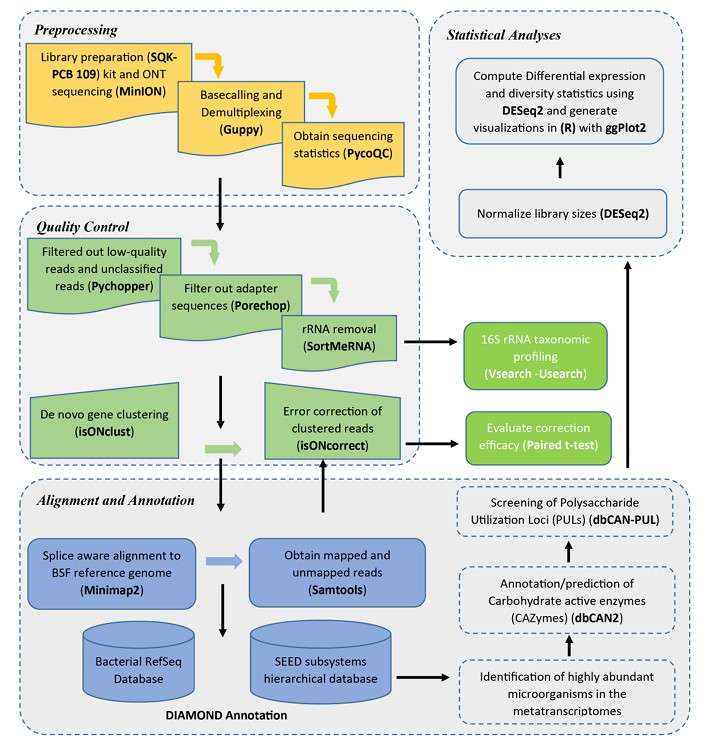 Analysis pipeline of Iso-Sep (Kariuki et al., 2023)
Iso-Seq data analysis process includes two main parts: pretreatment and quality control, as well as transcriptome reconstruction and isomer identification. In the preprocessing stage, the focus is on filtering low-quality data and correcting errors; In the stage of transcriptome reconstruction, it is necessary to use special tools and software to process the long reading data and compare it with the reference genome to identify isomers. This process ensures the accuracy and reliability of data analysis and provides a solid foundation for the follow-up gene expression research.
Data Interpretation and Analysis
Iso-seq data can comprehensively and accurately analyze the transcript structure, and provide high-precision full-length transcript information for understanding gene function, regulatory mechanism and disease-related transcriptome changes.
Identifying alternative splicing events
Alternative Splicing, (AS) is an important post-transcriptional regulatory mechanism in eukaryotes, which produces many protein isomers by splicing different exon combinations. The method for identifying AS events includes:
- Analysis based on RNA-seq data: Using tools such as Sh, BASIS and so on, inferring differential splicing events through statistical models. For example, BASIS method infers the existence of differential splicing isomers through Bayesian model.
- Visualization tools: such as SpliceSeq. And PRAPI It can display splicing maps and clASsify as event types (such as exon jumping, intron retention, etc.), and analyze its potential biological significance with functional annotation.
- Qualcomm screening technology: Such as IRAS, Qualcomm screening is realized by double fluorescent mini gene reporter, which can reduce false positive results and improve the detection efficiency of AS events.
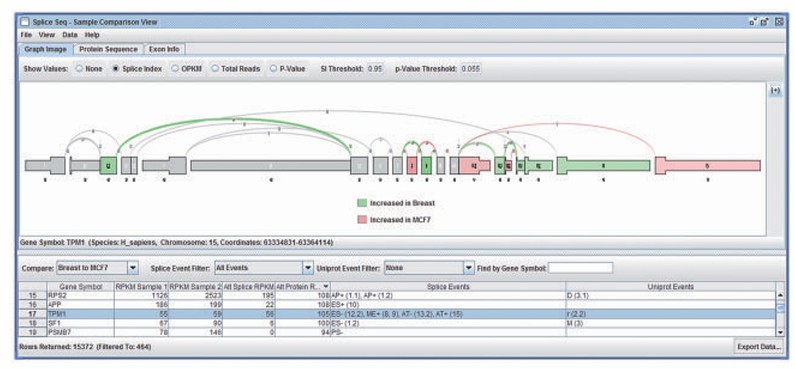 SpliceSeq comparison view of different patients samples (Michael et al., 2012)
Quantifying transcript expression levels
Quantification of transcript expression level is an important step to understand gene function and regulation.
- Data processing based on RNA-seq: using tools such as PRAPI and Swan, which can integrate full-length transcript data (Iso-Seq) and small reading data to provide accurate expression calculation.
- Quantitative PCR verification: For key AS events, quantitative PCR (qPCR) can be used for verification to ensure the reliability of the results.
- Statistical analysis methods: Such as Sh, the statistical model mentioned in is used to quantitatively analyze differentially expressed splicing isomers, which is further verified by genome annotation information.
Functional annotation and pathway analysis
Functional annotation and pathway analysis of AS events are helpful to reveal its biological significance.
- Function note: Through UniProt Protein produced by AS was classified by database, and its function in cell process was analyzed.
- Path analysis: Using tools such as Metascape To analyze the pathway enrichment of genes involved in AS events and identify their potential roles in diseases or physiological processes.
- Protein omics combination: For example, the study of AS events in human melanoma cell lines. The functional impact of AS event is verified by protein omics data.
Visualization of Iso-Seq data
Visualization of Iso-Seq data is a key step to show the complexity of transcriptome.
- Tool support: PRAPI And Swan Tools such as tools can generate visual charts of full-length transcripts and their homologues, which can help users intuitively understand the diversity of transcriptome.
- Combining RNA-Seq data: By integrating Iso-Seq and RNA-Seq data, the regulatory mechanism of post-transcriptional events can be displayed more comprehensively.
- High resolution display: Such as tools provided by PacBio, which supports the generation of high-quality full-length transcript maps and facilitates further analysis.
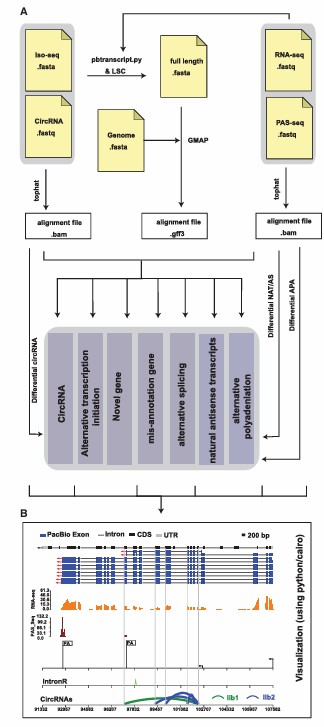 The overall design and visualization of Iso-Seq (Gao et al., 2018)
Case Studies and Practical Examples
Iso-seq can directly sequence the full-length transcript through PacBio single molecule sequencing platform without interrupting RNA, which can accurately identify the structural information of genes such as alternative splicing, transcription initiation site and polyA tail, and provide comprehensive and accurate full-length transcript information for transcriptome research.
Successful Iso-Seq analysis in published research
Study on plant transcriptome: Iso-Seq technology has shown remarkable advantages in the study of plant transcriptome. For example, through PacBio SMRT technology, researchers can generate full-length cDNA sequences, including 5' and 3' untranslated regions and polyadenylation tails, thus avoiding the transcription group reconstruction step. This enables Iso-Seq to detect information such as alternative splicing, transcription initiation site and polyadenylation site more accurately, and provides an important tool for the characterization of epigenetic regulatory networks.
Transcriptome analysis of soybean: In the research of soybean, Iso-Seq technology was used to comprehensively analyze the expression of genes and alleles. It was found that Iso-Seq data covered more than 80% of RNA-Seq coverage sites, and high-abundance alleles that RNA-Seq could not identify could be detected. This shows that Iso-Seq has higher sensitivity in revealing gene function and regulation mechanism.
 Summary of the Iso-Seq data (Liu et al., 2022)
Study on lncRNA Iso-Seq technology has also made a breakthrough in the discovery and functional annotation of long non-coding RNA. For example, in soybean research, a large number of new lncRNA were detected by Iso-Seq technology, and their functions were revealed by bioinformatics analysis.
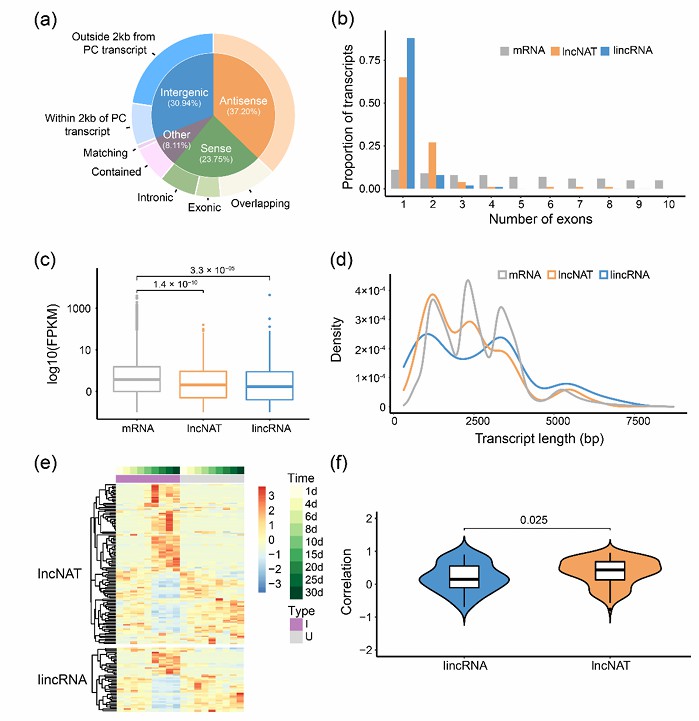 Characteristics of lncRNA in soybean root and nodule tissues (Liu et al., 2022)
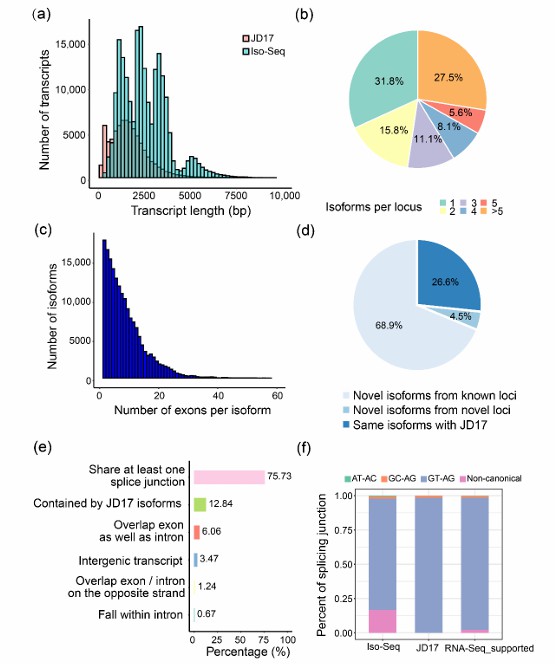
Application in cancer research: In cancer research, Iso-Seq technology is used to analyze the full-length transcriptome of tumor samples. For example, the research on COLO 205 cell line shows that Iso-Seq can significantly improve the detection ability of mutation, point deletion and structural variation when combined with short reading and long data. This technology provides a new perspective for cancer genomics research.
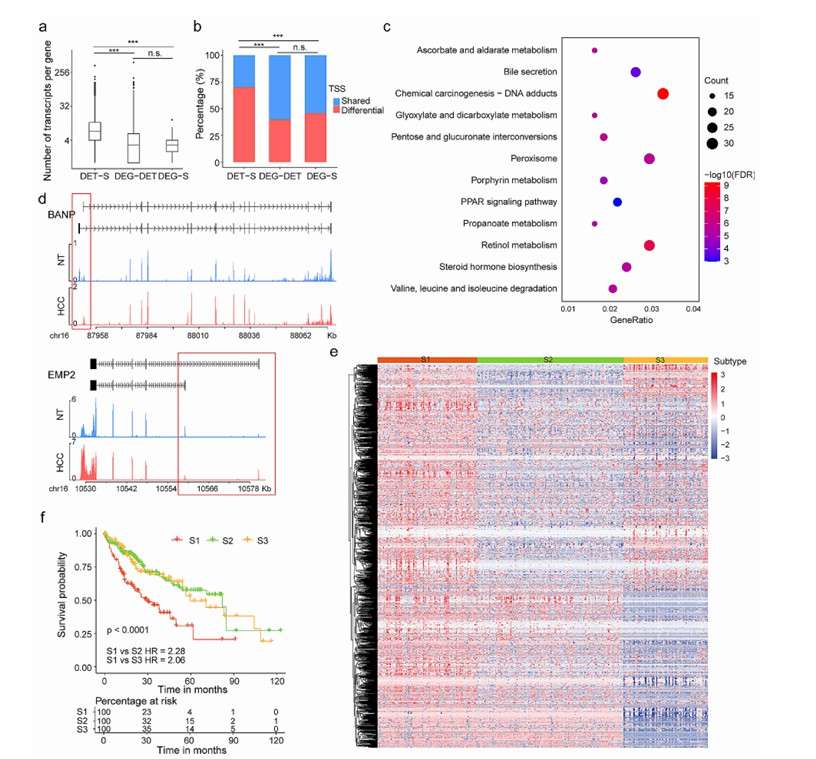 Landscape of isoform switching events in primary liver cancer (Chen et al., 2024)
Cross-species comparison: In the study of Egyptian gorilla (Macaca monophora), the researchers successfully constructed genome assembly at chromosome level by combining Illumina and PacBio Hi-C technology, and comprehensively analyzed the full-length transcriptome by Iso-Seq technology. The results showed that with the increase of sequencing data, the number of transcript isomers gradually increased, thus improving the quality of gene annotation.
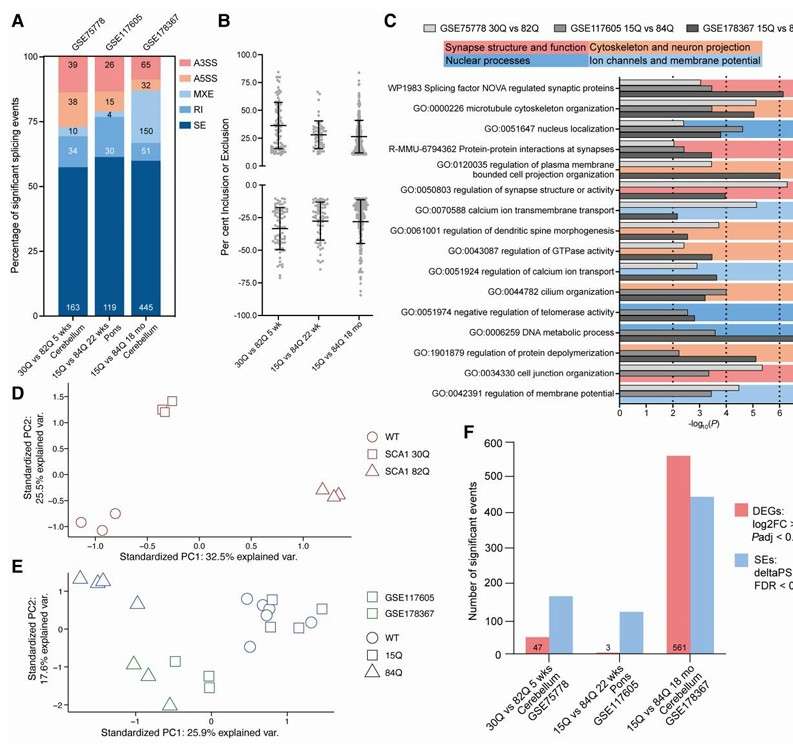 Different splicing profiles in short or pathogenic repeat length mouse models (Hannah et al., 2024)
Common problems and solving skills
Annotation and classification of isomers: There may be redundancy or misclassification in the process of isomer annotation. Use tools such as TAPSPI and SQANTI3 to annotate and classify isomers efficiently. These tools can improve the accuracy of annotations and reduce false.
Complexity of data analysis process: The data analysis process is complicated and requires multiple steps to process the original data. Use automated tools such as nf Iso-seq or TAGET, which can simplify the data analysis process, reduce human errors and improve efficiency.
High demand for computing resources: Iso-Seq data analysis requires a lot of computing resources. Adopt distributed computing framework or cloud services (such as AWS or Google Cloud) to reduce the demand for local computing resources.
AS event detection: The detection of alternative AS may be limited by short reading and long data. Combine short reading and long reading data with Iso-Seq data for joint analysis to improve the detection accuracy of AS events.
False positives in data analysis: False positive results may occur during data analysis. Use strict quality control standards and multiple verification methods (such as RT-QCPR) to ensure the reliability of the results.
Conclusion
Iso-Seq is a full-length transcriptome sequencing method based on SMRT sequencing technology. Its core steps include the generation of original reading segments, error correction and splicing, refining and annotation of transcripts, isomer prediction and expression calculation, and data visualization and analysis.
In Iso-Seq research, accurate data interpretation is very important for the following reasons:
Support complex transcriptome analysis: Iso-Seq data can be used to deeply analyze the post-transcriptional regulatory network of genes, such as splicing selectivity, gene fusion events and their effects on protein function. Accurate data interpretation is helpful to reveal these complex biological mechanisms.
Promote cross-species comparison research: Iso-Seq provides an important tool for cross-species comparison by constructing a full-length transcript database of plants or integrating other omics data. For example, using Iso-Seq data, we can analyze the differences of gene expression between different species and their evolutionary relationships.
Promote clinical research and disease diagnosis: Iso-Seq technology has important application value in disease-related gene variation detection and gene expression difference analysis. Accurate data interpretation can help identify potential disease markers or therapeutic targets.
Therefore, Iso-Seq research needs not only high-quality data generation and processing technology, but also advanced bioinformatics tools and algorithms to ensure the accuracy of data interpretation, thus promoting the development of biological research and clinical application.
References:
- Shannon E Ellis, Simone Gupta, Foram N Ashar, Joel Bader, Andrew B West and Dan E Arking. "RNA-Seq optimization with eQTL gold standards." BMC Genomics (2013) 14:892. http://www.biomedcentral.com/1471-2164/14/892
-
Eric G. Kariuki, Caleb Kibet, Juan C. Paredes, Gerald Mboowa, Oscar Mwaura, John Njogu, Daniel Masiga, Timothy D. H. Bugg and Chrysantus M. Tanga. "Metatranscriptomic analysis of the gut microbiome of black soldier f ly larvae reared on lignocellulose-rich fiber diets unveils key lignocellulolytic enzymes." Frontiers in Microbiology (2023): 26. https://doi.org/10.3389/fmicb.2023.1120224
-
Natacha Koenig, Patrice Baa-Puyoulet, Amélie Lafont, Isis Lorenzo-Colina, Vincent Navratil, Maxime Leprêtre and Kevin Sugier. "Proteogenomic reconstruction of organ-specific metabolic networks in an environmental sentinel species, the amphipod Gammarus fossarum." BioRxiv (2024): 5. https://doi.org/10.1101/2024.05.04.592373
-
In Seok Yang and Sangwoo Kim. "Analysis of Whole Transcriptome Sequencing Data: Workflow and Software." Genomics & Inform (2015):119-125. http://dx.doi.org/10.5808/GI.2015.13.4.119
-
Michael C. Ryan1, James Cleland, RyangGuk Kim, Wong Wingchung and John N. Weinstein. "SpliceSeq: a resource for analysis and visualization of RNA-Seq data on alternative splicing and its functional impacts." BIOINFORMATICS APPLICATIONS NOTE (2012): 2385-2387. doi:10.1093/bioinformatics/bts452
-
Gao Yubang, Wang Huiyuan, Zhang Hangxiao, Wang Yongsheng, Chen Jinfeng and Gu Lianfeng. "PRAPI: post-transcriptional regulation analysis pipeline for Iso-Seq." Bioinformatics (2018) 1580-1582. doi: 10.1093/bioinformatics/btx830
-
Hannah K. Shorrock, Claudia D. Lennon, Asmer Aliyeva, Emily E. Davey and Cristina C. DeMeo. "Widespread alternative splicing dysregulation occurs presymptomatically in CAG expansion spinocerebellar ataxias." BRAIN (2024): 486-504. https://doi.org/10.1093/brain/awad329
-
Liu Jing, Chen Shengcai, Liu Min and Zhang Jianwei. "Full-Length Transcriptome Sequencing Reveals Alternative Splicing and lncRNA Regulation during Nodule Development in Glycine max." Int. J. Mol. Sci. (2022) 23: 7371. https://doi.org/10.3390/ijms23137371
-
Chen Zhiao, Shi Qili, Zhao Yiming, Xu Midie and He Xianghuo. "Long-read transcriptome landscapes of primary and metastatic liver cancers at transcript resolution." Biomarker Research (2024) 12:4. https://doi.org/10.1186/s40364-023-00554-w

 Sample Submission Guidelines


