

We use cookies to understand how you use our site and to improve the overall user experience. This includes personalizing content and advertising. Read our Privacy Policy
Accept Cookies
High-throughput chromosome conformation capture (Hi-C) is a high-throughput sequencing method used to study the three-dimensional structure of genome. Its core principle is to construct a chromatin interaction network by capturing the spatial interaction between chromatin fragments, thus revealing the three-dimensional spatial structure and functional characteristics of the genome. It provides important information for understanding gene regulation, cell determination and disease mechanism.
Analysis of three-dimensional structure of genome: Hi-C technology constructs a three-dimensional map of the genome by capturing the interaction between chromatins. These maps reveal the advanced structure of chromosomes, such as chromosome domains, topologically associated domains (TADs) and chromatin loops. These structures play a key role in gene transcription, DNA replication and genome stability.
Gene expression regulation: The three-dimensional structure of chromatin directly affects gene expression. Hi-C data can reveal the spatial relationship between genes and between genes and regulatory elements, thus helping to understand the mechanism of gene expression regulation. For example, genes within TADs usually have similar expression patterns, while genes across TADs may show different expression characteristics.
Disease research: Hi-C technology has an important application in disease research. By analyzing the Hi-C data in disease samples, we can identify the chromatin structural changes related to diseases. For example, in tumor research, Hi-C data reveals the relationship between chromosome structural variation and abnormal gene expression. In addition, Hi-C can also be used to study the genetic background of neurodegenerative diseases and mental diseases.
Study on single cell level: Single-cell Hi-C technology can capture genomic structural information at the single-cell level, which is of great significance for studying cell differentiation, structural variation and genomic differences among different cell types.
Learn More: Single-Cell Hi-C: Unveiling Chromosome Structure and Its Applications in Genomic Research
To start learning Hi-C data analysis, it needs to know some basic concepts and terms first. Hi-C technique is a high-throughput sequencing method, which is used to study the three-dimensional structure of chromatin. Its core is to capture the interaction between adjacent chromatin fragments in a cell and generate a contact map, thus revealing the three-dimensional organizational structure of the genome.
Basic concepts and terminology
Contact frequency matrix: The core of Hi-C data is the contact frequency matrix, which represents the intensity of interaction between different regions in the genome. Each element of the matrix represents the contact frequency between two chromatin regions.
TADs: TADs are the basic units in chromatin structure and are usually identified by local enhancement regions in Hi-C data.
Chromatin Loops: Chromatin loops are the connecting structures between TADs, which are usually mediated by factors such as CTCF.
Annotation of genomic regions: Hi-C data can be used to annotate the functions of genomic regions, such as enhancers and promoters.
Tools and resources
For beginners, the following are some commonly used Hi-C data analysis tools and resources:
A. HiCExplorer
Function: HiCExplorer is an open source Python toolkit for processing, analyzing and visualizing Hi-C data. It includes preprocessing, quality control, TAD detection, interactive fragment analysis and other functions.
Usage methods: Users can operate through the command line or Web server. Web server supports many functions, such as quality control, TAD detection, heatmap generation and so on.
Advantages:It has friendly interface,which is suitable for beginners, and supporting multiple output formats.
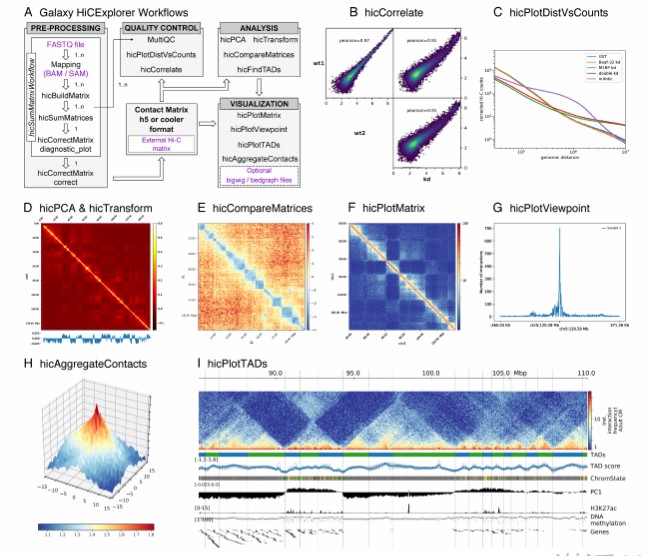 Galaxy HiCExplorer workflows and tools (Wolff et al., 2018)
B. Juicebox
Function: Juicebox is an interactive Hi-C data visualization tool, which supports data loading, browsing, interaction and generating Hi-C interaction diagrams.
Usage methods: It can run on modern browsers and support the integrated display of multiple data sources.
C. HiGlass
Function: HiGlass is a modular Web application, which supports the visualization of high-dimensional genome data. It combines modern Web technology and art design.
Usage methods: Users can upload and compare multiple Hi-C data sets through the Web interface.
D. DLO Hi-C Tools
Function: DLO Hi-C Tools supports data analysis of DLO Hi-C technology, has high signal-to-noise ratio, and can be used for early quality control.
Usage methods: It is suitable for analyzing the three-dimensional structure of genome and supports Linux and Mac systems.
E. scHiCancer
Function: scHiCancer is a tool for single cell Hi-C data analysis, which is suitable for studying cancer-related chromatin structural changes.
Usage methods: Through pip installation, it supports multiple data types.
Hi-C data analysis is a complex but very promising research field. For beginners, mastering basic concepts and terms is the first step, and then practicing by using appropriate tools and resources. With the continuous development of technology, Hi-C data analysis will play an increasingly important role in genomics research.
Service you may intersted in
Hi-C data analysis is mainly used to study the three-dimensional structure of chromatin. Firstly, Hi-C data is obtained through experiments, and then data preprocessing is carried out, including filtering low-quality reading segments and comparing them with reference genomes. Then the interaction frequency of chromatin is calculated and the contact matrix is constructed. On this basis, we can recognize chromatin domains, such as TADs, and the interaction between chromosomes. It can also analyze the remote interaction between gene regulatory elements and genes, and explore the regulation mechanism of gene expression. Hi-C data analysis provides key information for understanding the functional organization and regulation of genome.
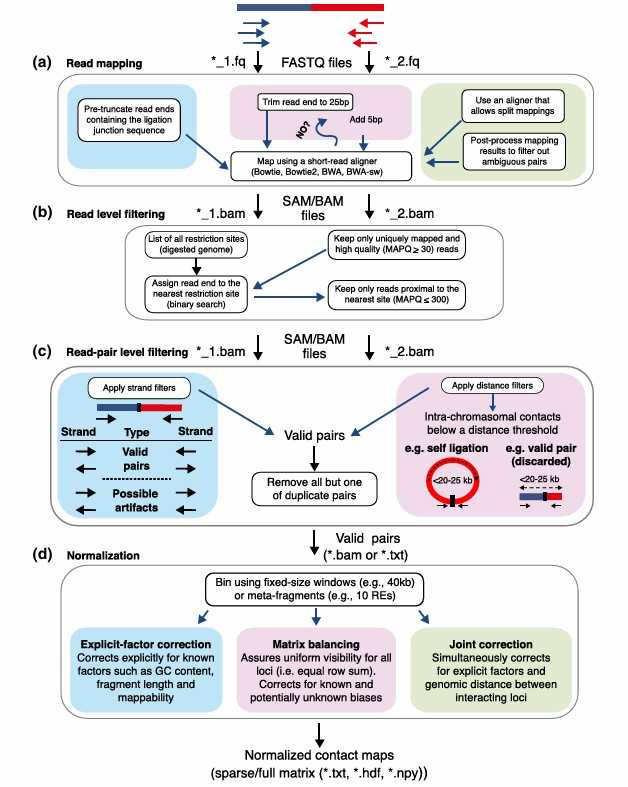
The initial processing steps of mapping, filtering and classifying Hi-C data for Hi-C reading usually include shearing reading (if necessary), comparing the reading to the corresponding reference genome by analyzing specific pre-processing and post-processing, so as to increase the percentage of mapping reading, and filtering mapping reading and reading pairs at several different levels. Details of several mapping and filtering methods for Hi-C data are outlined below. Please note that in order to distinguish between single-ended and double-ended sequencing data, the author called them "reads" and "read pairs" respectively.
Mapping
There are many methods to deal with the mapping read by Hi-C. The simplest method is to filter out any data that is not completely mapped to the genome, because it is a chimera. This method may be acceptable when the selected fragment is very long (800 bp) and the reading length is relatively short (50 bp). However, shorter fragment length and longer reading are more commonly used in Hi-C experiments. For example, selecting a fragment size of 300-500 bp and sequencing with 101 bp reading will result in about 20% of sequencing reading pairs having at least one chimeric end. At present, there are at least four different methods to "rescue" information from this embedded Hi-C reading, namely, pre-truncation method, iterative mapping method, split alignment method and split if unmapped method.
 Overview of Hi-C analysis pipelines (Ferhat et al., 2015)
Filtering data reads
Once a single read is mapped to a genome, the next step is to decide which of these mapped reads are "trustworthy". The first step is to apply standard filters to the number of mismatches, the quality of mapping (MAPQ score) and the uniqueness of mapped reading segments, similar to other sequencing-based detection. The second step is to create a list of all possible restriction sites in the reference genome (not to be confused with the ligation sequence) and assign each reading segment to the nearest restriction site. It should be noted that the number of restriction sites may be large (for human genome, HindIII and MboI are > 800,000 and > 7 million respectively), so it is necessary to use scalable methods, such as binary search, to find the nearest restriction site. Read it every time. The third step, according to the distance between the starting coordinates of each read and the nearest restriction site, filter out the reads that are inconsistent with the size-selection step.
In most Hi-C analysis processes, the pairs of reading segments that both ends successfully pass the initial filter are further divided into several categories. The purpose of this classification is to identify and further process the pairs that provide three-dimensional chromatin conformation information (called "information pairs"). These read-pair filtering methods can be divided into two categories, chain filters and distance filters. Many Hi-C analysis workshop use a combination of these two methods to ensure that all possible read pairs are strictly filtered.
Remove duplicates
The last filtering step to remove duplicates is to identify and delete duplicate read pairs. Because the standard Hi-C test produces readings from a group of cells, these repetitions may indeed be PCR copies of valid reading pairs from different cells or reading pairs from a single cell. Due to the lack of a method to distinguish the two situations, the current practice is to simply discard all the contents except one pair from a set of duplicates. This method avoids any potential PCR bias, but at the cost of losing some potential information reading counts. However, due to the high complexity of Hi-C libraries, the repetition rate is usually very low. Deduplication can be performed by Picard or a simple shell.
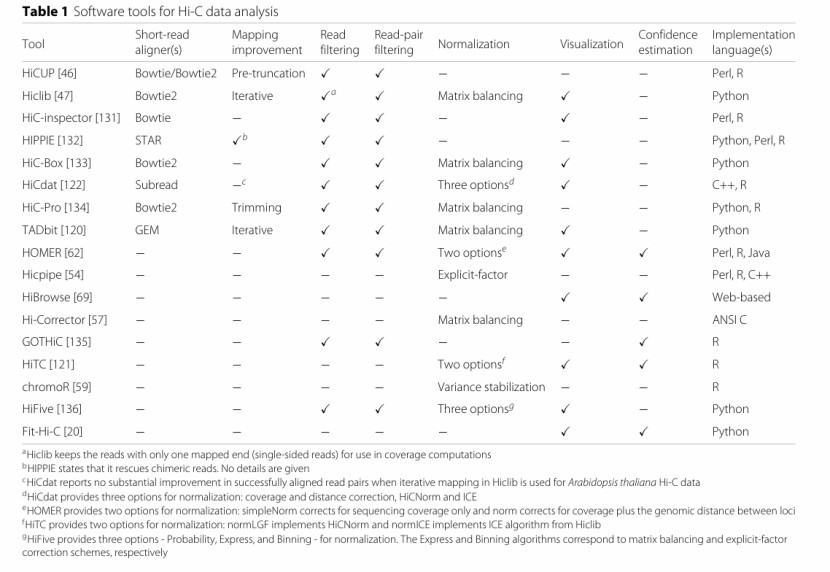 Software tools for Hi-C data analysis (Ferhat et al., 2015)
Generating contact matrix and visualization
After data preprocessing, the next step is to generate contact matrix and visualize it.
Generating contact matrix: Sorting out the reading segment counts after boxing into contact matrix, and each element in the matrix represents the interaction frequency between two genome regions.
Normalization of contact matrix: Normalize the contact matrix to eliminate experimental deviation and background noise.
Visualization: Use visualization tools to convert the contact matrix into graphic representation. Common visualization methods include Heatmap and Force-directed graph. Commonly used visualization tools include HiGlass and HiPiler, which can help users visually observe the structure and TADs of Hi-C data.
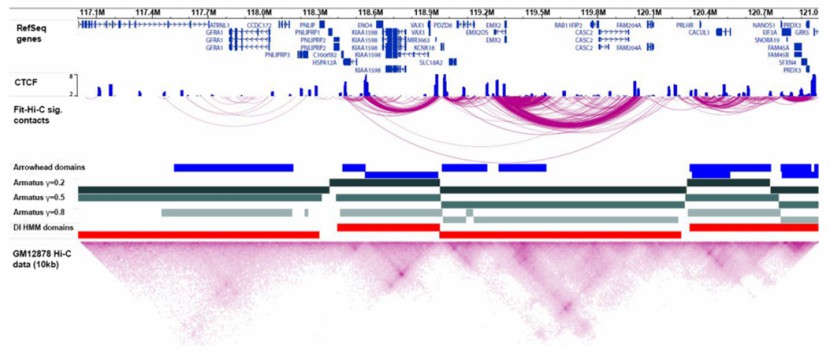 Visualization of Hi-C data (Ferhat et al., 2015)
Hi-C advanced analysis techniques include data preprocessing, such as noise removal and deviation correction, to improve data quality. It also covers methods to identify chromatin interactions, such as finding chromatin rings and TADs. By analyzing these interactions, we can understand the mechanism of gene regulation. In addition, integrating other omics data, such as transcriptome data, can more comprehensively analyze genome function and help reveal complex biological processes and molecular mechanisms of diseases.
Identification of significant interactions: The identification of significant interaction between Hi-C data is one of the basic steps of Hi-C analysis. Traditional Hi-C peak calling methods usually rely on statistical models to identify significant chromatin interaction regions. For example, MACS2 is a common tool for identifying significant peaks in Hi-C data. In addition, some researches have developed methods based on deep learning, such as DeepHi-C and HiCNN, which improve the resolution and accuracy of Hi-C data by training deep neural networks.
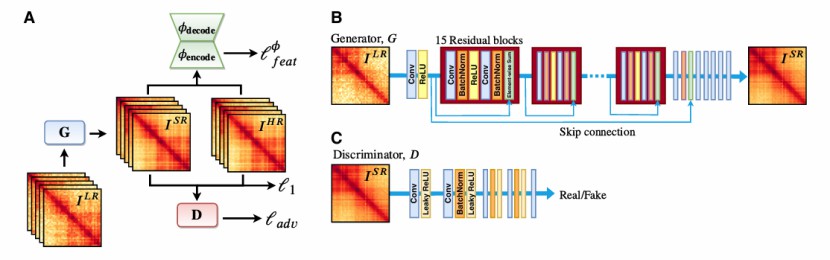 Overview of the HiCSR framework (Michael et al., 2020)
Integration with other omics data: Hi-C data can be integrated with other omics data (such as ChIP-seq and RNA-seq) to obtain more comprehensive genome regulation information. For example, ChIP-seq data can be used to identify specific protein binding sites, while RNA-seq data can be used to analyze gene expression levels. By integrating these data, we can better understand the relationship between chromatin structure and gene expression.
Visualization of Hi-C data: It is an important means to understand its complex structure. A variety of tools and methods have been developed for the visualization of Hi-C data, such as NuPlot, HiCPlus and 3DIV. These tools can generate interactive 3D views to help researchers visually observe the spatial distribution of chromatin interaction. Furthermore, some researches have developed methods based on atlas to improve the visualization and interpretation of Hi-C data. For example, genome mapping is used to correct the structural variation in Hi-C data, thus improving the accuracy and reliability of the data.
 HiCube user interface (Ye et al., 2023)
Enhancement of high-resolution Hi-C data: High-resolution Hi-C data is very important for studying chromatin structure and regulation mechanism. However, traditional Hi-C data usually have low resolution. In order to improve the resolution, some studies use deep learning methods, such as GAN and CNN, to enhance the resolution of Hi-C data.
Multiomics data analysis: Hi-C data can be integrated with other omics data (such as ChIP-seq, RNA-seq and ATAC-seq). This integration analysis can help researchers to understand the changes of gene regulatory network and chromatin structure more comprehensively. For example, by integrating Hi-C data and RNA-seq data, we can identify the regulatory elements and gene loci of a specific chromatin ring, thus obtaining a list of genes regulated by different rings.
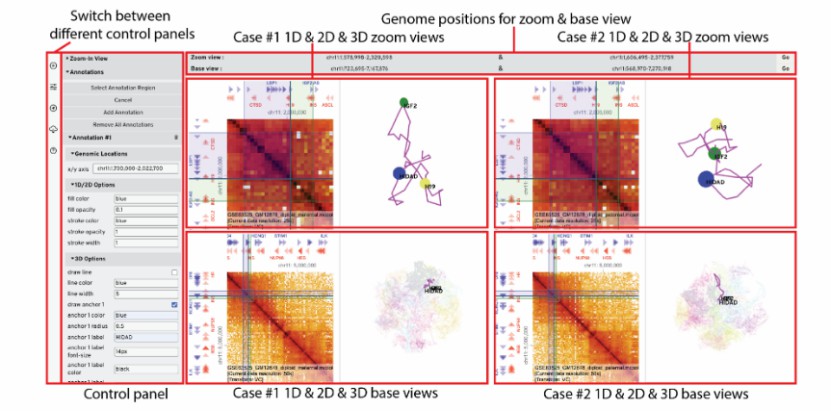
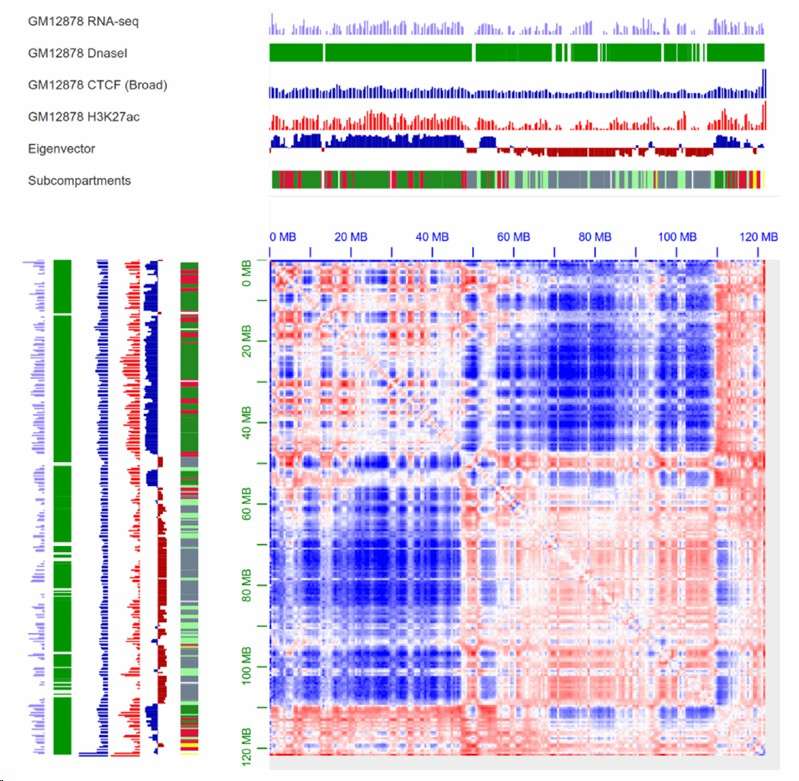 A/B compartment visualization with annotation (Gong et al., 2021)
Advanced Hi-C data analysis technology covers many aspects, such as significant interaction identification, integration with other omics data, advanced visualization and high-resolution data enhancement. The development of these technologies has greatly promoted the understanding of the three-dimensional structure and function of genome.
Learn More:
Hi-C data analysis plays a key role in analyzing the three-dimensional structure of genome and gene regulation. The key points include data preprocessing, denoising and rectification, using methods to identify chromatin interactions such as chromatin rings and TADs, and integrating multi-group data for in-depth exploration. Case studies show its important discoveries in gene regulation and chromosome conformation. To avoid common pitfalls in practice, experienced people can adopt advanced skills.
In the future, Hi-C data analysis can make great efforts in improving data resolution, optimizing algorithms to identify structures more accurately, and expanding the integration depth of multi-omics, so as to further reveal complex biological processes and molecular mechanisms of diseases and help the development of life sciences.
References
Terms & Conditions Privacy Policy Copyright © CD Genomics. All rights reserved.