

We use cookies to understand how you use our site and to improve the overall user experience. This includes personalizing content and advertising. Read our Privacy Policy
Accept Cookies
High-throughput chromosome conformation capture (Hi-C) is an important tool for studying the three-dimensional structure of genome. By measuring the interaction distance between almost every pair of loci in the genome, Hi-C technology reveals the advanced structure of chromatin, including A/B compartments, topological correlation domains (TADs), enhancer-promoter interactions and bands. These structures are of great significance for understanding gene expression regulation, cell differentiation and disease occurrence.
However, the analysis of Hi-C data is complex and challenging. Firstly, due to the high cost of sequencing, the resolution of Hi-C data is usually low, such as 25kb or 50kb, which limits the analysis of fine genome structure. Secondly, Hi-C data contains a lot of high-frequency details and sharp edges, which may be excessively smoothed by traditional smoothing methods, resulting in inaccurate analysis results. In addition, the processing and analysis of Hi-C data need complex bioinformatics tools and algorithms.
In order to overcome these challenges, a variety of advanced Hi-C data analysis methods have been developed in recent years. For example, DeepHiC improves the resolution of Hi-C data by using Generative Confrontation Network (GAN), so as to predict the advanced structure of chromatin more accurately. In addition, FreeHiC improves the accuracy and efficacy of different Hi-C analysis methods by simulating and enhancing Hi-C data. These methods not only improve the accuracy of data analysis, but also provide new possibilities for the application of Hi-C data.
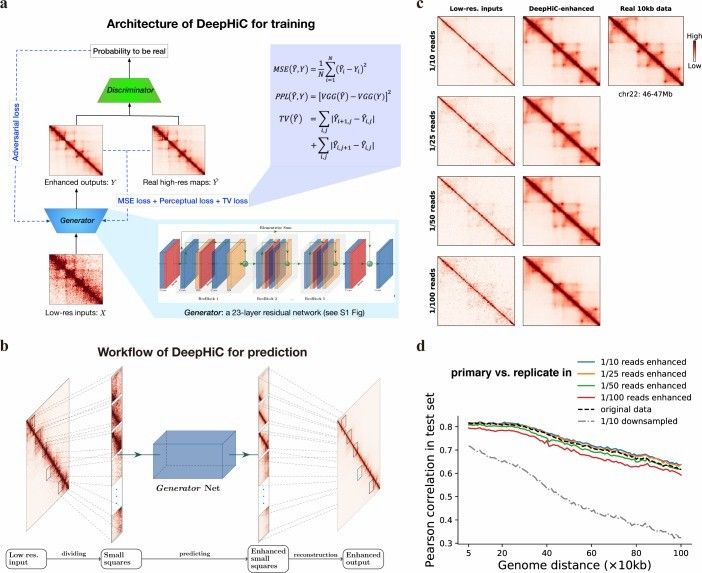 Overview of the DeepHiC (Hong et al., 2020)
Importance of advanced Hi-C data analysis
Improve the resolution: Traditional Hi-C data analysis methods usually rely on mean regression or loss function (such as MSE), which may not accurately capture the high-frequency details of chromatin structure. The resolution of Hi-C data can be significantly improved by generating deep learning techniques such as confrontation network, so as to analyze the advanced structure of chromatin more accurately.
Enhance data quality: The quality of Hi-C data directly affects the accuracy and reliability of analysis results. Through data standardization, artifact removal and error classification, the quality of Hi-C data can be significantly improved. For example, FAN-C software provides powerful data visualization and analysis tools through matrix comparison, PCA analysis and drawing functions.
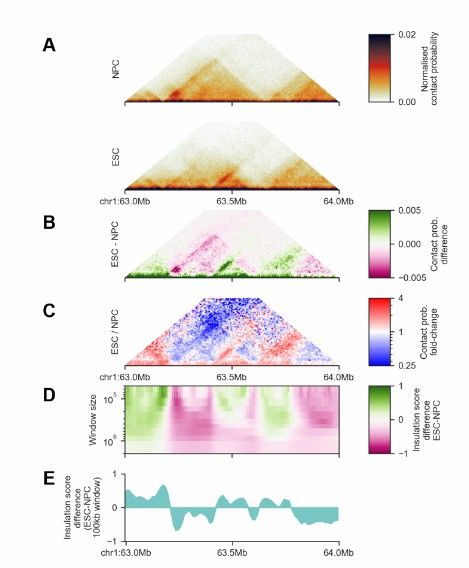 FAN-C Matrix and feature comparison (Kai et al., 2020)
Support multi-omics integration: The integration analysis of Hi-C data and other omics data (such as RNA-seq, ChIP-seq, etc.) can reveal the complex relationship between the three-dimensional structure of genome and gene expression regulation. For example, the difference analysis method based on Hi-C data can detect the difference of chromatin interaction between different cell types or tissues.
Promoting disease research: Hi-C technology is increasingly widely used in disease research. By analyzing Hi-C data in tumor cells, we can reveal the influence of DNA copy number variation (CNV) on Hi-C contact matrix. In addition, high-resolution Hi-C analysis is helpful to understand the pathogenesis of complex genetic diseases.
Simplify the experimental flow: With the development of technology, the experimental flow of Hi-C is gradually simplified. For example, low-input Hi-C protocols (such as eHiC) can generate high-resolution Hi-C libraries with less than 0.1 million cells. This facilitates the study of small samples or specific cell groups.
In Hi-C data analysis, the application of machine learning and AI, network analysis, graph theory and spatio-temporal analysis are the current research hotspots. The following is a detailed discussion of these areas.
Application of machine learning and AI in Hi-C analysis
Predict model: One of the main applications of machine learning and AI technology in Hi-C data analysis is to construct a prediction model to predict chromatin folding and gene expression regulation. For example, by training a deep learning model, we can use high-resolution Hi-C data and one-dimensional data (such as ChIP-seq peak, sequence similarity and Dam-ID) to predict the impact of sequence variation on genome architecture. These models can improve the understanding of chromatin folding mechanism and provide support for the prediction of priority mutation sites in genome.
Data enhancement and simulation: In order to overcome the high cost of Hi-C data generation, researchers developed data enhancement and simulation technology. For example, FreeHiC tool simulates Hi-C data by nonparametric strategy, thus providing benchmark test and data enhancement for the development of Hi-C data analysis methods. This method helps to improve the generalization ability and robustness of the model.
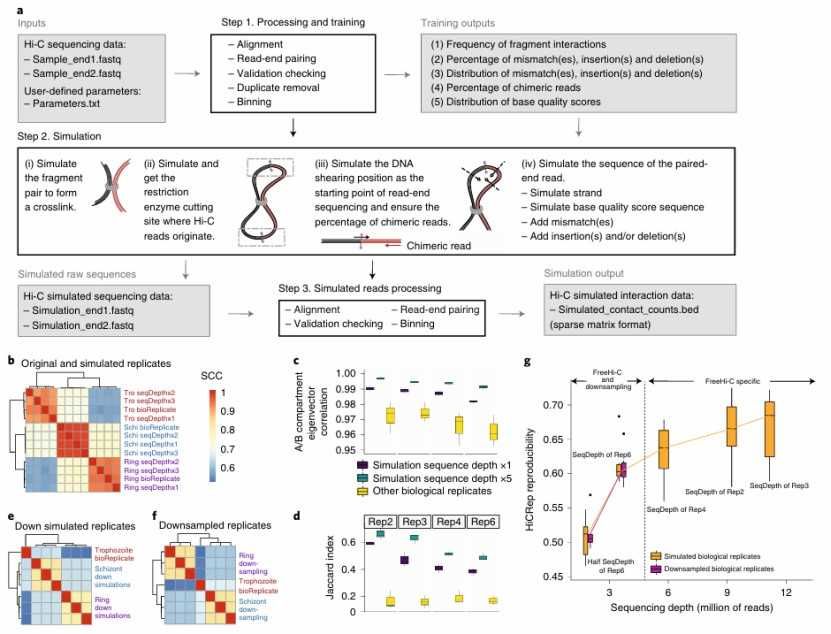 FreeHi-C enables simulating high-fidelity Hi-C data (Zheng et al., 2020)
Feature detection and classification: Computer vision method has also been widely used in Hi-C data analysis. For example, the HCFinder tool can improve the accuracy and repeatability of feature detection by calling tools such as HiCCUPS circularly. In addition, the Hi-C data recognition method based on geometric pattern is also used for single cell Hi-C analysis and chromatin ring detection.
Application of network analysis and graph theory in Hi-C data
Chromatin interaction network: Hi-C data can be used to construct chromatin interaction network and reveal the complexity of three-dimensional structure of genome. For example, the NuChart tool integrates Hi-C data with genome organization knowledge, constructs a map with the central gene as the neighborhood, and maps multiple omics features. This method is helpful to understand the biomarkers of different cell types and reveal the key role of chromatin ring in gene expression regulation.
Graph theory algorithm: Graph theory algorithm also plays an important role in Hi-C data analysis. For example, the TADfit tool identifies TADs by analyzing the replicated Hi-C data. In addition, NuChart tool uses graph theory algorithm to visualize and analyze Hi-C data to help users explore chromatin spatial organization.
Genomic interaction in spatio-temporal analysis
Dynamic change analysis: Hi-C technology can be used not only to study the static genome structure, but also to analyze the dynamic changes of genome interaction. For example, by comparing Hi-C data under different conditions, we can reveal the changes of genome structure in disease state. This analysis is helpful to understand how genome organization affects cell function and disease progression.
Multiscale analysis: Hi-C technology can be combined with other high-throughput sequencing technologies (such as RNA-seq and ChIP-seq) for multi-scale analysis. For example, by integrating Hi-C data with other omics data, the relationship between chromatin interaction network and gene expression can be revealed. This multi-scale analysis method is helpful to fully understand the function and regulation mechanism of genome.
Service you may intersted in
Learn More:
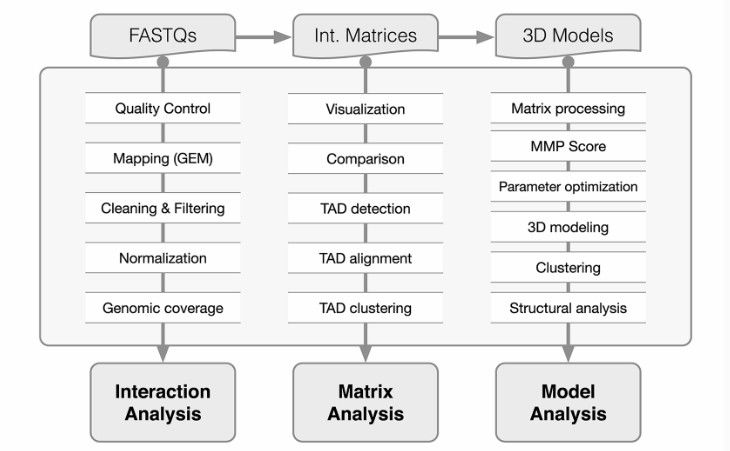 TADbit flowchart (Francois et al., 2017)
Cooltools: It is a collection of computing methods designed to process high-resolution genome folding data. It provides Python API and command line tools, supports modular methods, and is suitable for routine analysis and advanced analysis. Cooltools is closely integrated with Cooler, which is a tool for storing and analyzing Hi-C data and supports the standard split-box Hi-C format.
FAN-C: It is a functional framework for the analysis and visualization of Hi-C data. It supports matrix comparison, principal component analysis (PCA) and various drawing functions. FAN-C also provides interactive visualization tools to support heat maps and other diagnostic charts based on user-defined attributes.
DLO Hi-C Tool: It is an efficient and low-cost tool, which focuses on the digestion-connection of Hi-C data-limited to Hi-C (DLO) analysis. It provides a flexible and multifunctional pipeline, from original sequencing reading processing to standardized contact map, and includes quality control in different stages.
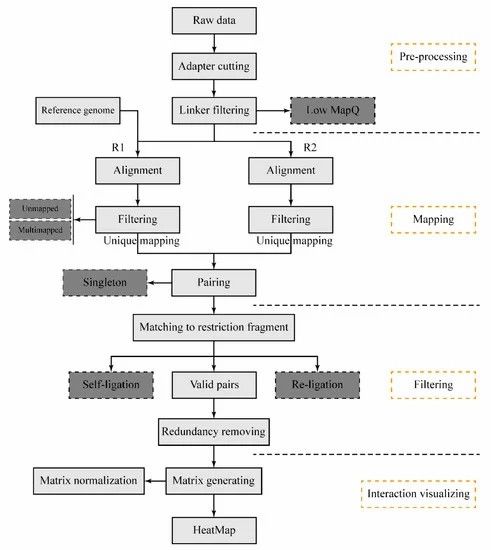 The schematic pipeline for the DLO Hi-C tool (Hong et al., 2020)
NuChart-II: It is an R prototype software based on graphics, which is used to annotate and visualize Hi-C data. It uses gene-centered method to analyze the characteristic knowledge of chromatin tissue spatial genome.
3D Genome Builder (3DGB): 3DGB is a bioinformatics workflow, which is used to simplify the analysis of Hi-C data and the creation of 3D models. Based on Hi-C experimental results, it automatically executes key bioinformatics steps and generates PDB files for further analysis.
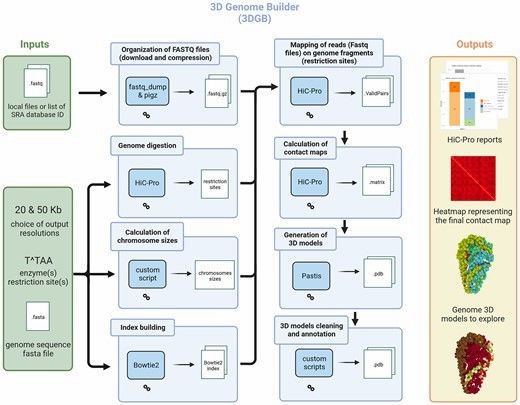 General overview of the 3DGB workflow (Thibault et al., 2023)
Puzzle Hi-C: It is a scaffold software based on Hi-C data, which uses triangle region and dynamic window strategy to reduce the interference caused by long-distance interaction and improve the accuracy of genome assembly.
Genome Architecture Model (GEM): GEM is a computational method, which restores the long-term genomic interaction missing from the original Hi-C data through automatic parameter adjustment and multi-conformation optimization strategy.
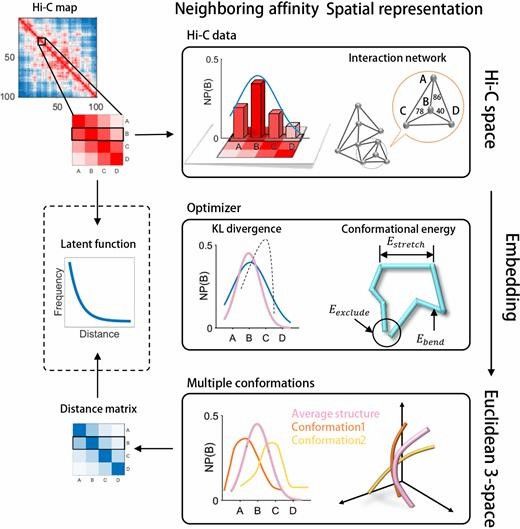 A schematic illustration of the GEM pipeline (Zhu et al., 2018)
FreeHi-C: It is a high-fidelity Hi-C data simulator, which is used for benchmark testing and data enhancement. It uses nonparametric strategy to estimate the interaction distribution between genome fragments from a given sample.
coMET: It is an R package for processing and visualizing Hi-C data. It supports downloading heatmaps from experimental data and provides files to define the information of each bin that constitutes the interaction matrix.
Juicer Tools: It used to preprocess Hi-C data and generate multi-resolution hic files.
Dekkerlab/cCamapping: It used to read, group and correct Hi-C data.
World-cdic-pipeline: It used to generate whole genome thermogram and chromatin segregation analysis.
These tools and platforms have their own characteristics and are suitable for different research needs. For example, Cooltools and TADbit are suitable for high-resolution data analysis and structural feature identification, while FAN-C and HiCPlotter provide powerful visualization functions. In addition, tools such as DLO Hi-C Tool and FreeHi-C focus on specific data processing and simulation tasks. Researchers can choose appropriate tools for data analysis according to specific research objectives.
Hi-C data can be used to study the three-dimensional structure of genome. Advanced analysis techniques include data preprocessing, such as noise removal and deviation correction, to improve data quality. It also covers methods to identify chromatin interactions, such as finding chromatin rings and TADs. By analyzing these interactions, we can understand the mechanism of gene regulation. In addition, integrating other omics data, such as transcriptome data, can more comprehensively analyze genome function and help reveal complex biological processes and molecular mechanisms of diseases.
The effect of chromatin remodeling complex on genome structure
In a study in 2022, the researchers analyzed the genome structure changes of chromatin remodeling enzyme mutants in Arabidopsis mustard by Hi-C technology. It was found that chromatin remodeling enzyme mutants (such as BRM, IPO8 and PKL) led to a significant increase in the frequency of switching rooms in A/B compartments, while the frequency of switching rooms in wild plants was lower (0.89%). In addition, the mutation of chromatin remodeling enzyme in the mutant also led to the prolonged duration of A/B compartment switching mediated by chromatin remodeling enzyme. These results indicate that chromatin remodeling enzyme plays an important role in maintaining chromatin compartmentalization, and its mutation will lead to the global change of 3D chromatin structure.
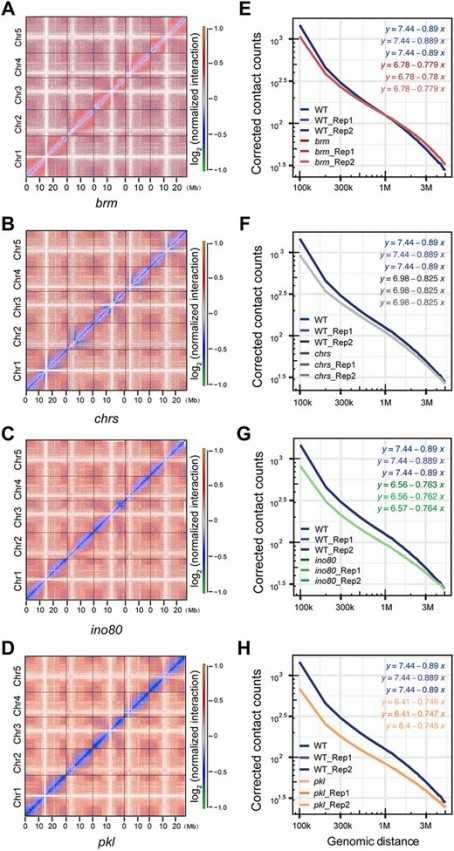 Mutations in chromatin remodeling enzymes cause rear-rangement of chromatin high-order structure (Yang et al., 2022)
The role of DNA-loop-extruding SMC complex in the formation of chromatin structure
A study in 2020 explored the role of DNA-loop-extruding SMC complex in the formation of chromatin structure. Through experiments and theoretical models, the research team found that too many SMC complexes enter the nested configuration, which will lead to the inconsistency of Hi-C data with expectations. In order to test this hypothesis, the researchers added the auxiliary unloading hypothesis to the blocking and bypassing model, and adjusted the relative strength of SMC composite. Finally, they got the experimental results which are highly consistent with the Hi-C data. A comprehensive model is also proposed, including the meeting rules of SMC complexes (such as bypass and auxiliary unloading) and basic chromatin dynamics rules (such as the number of SMC complexes on each chromosome and the rate of loading sites on each chromosome). These findings reveal the complex mechanism of SMC complex in chromatin structure formation.
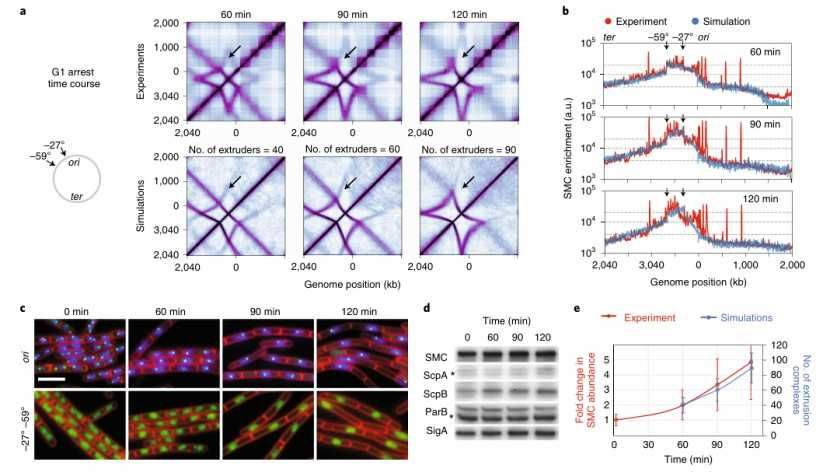 The number of SMC complexes per chromosome tunes the shape of contact maps (Hugo et al., 2021)
Application of Hi-C technology in cancer research
Hi-C technology has important application value in cancer research. A review article in 2017 summarized various applications of Hi-C technology in cancer research, including detecting chromosome rearrangement and copy number variation in human tumors. It is found that there are different chromosome rearrangements between normal cells and cancer cells, which may be related to the occurrence and progress of tumors. In addition, Hi-C technology is also used to study the formation mechanism of nuclear structure, such as the extrusion of chromatin ring and the formation of topological domain.
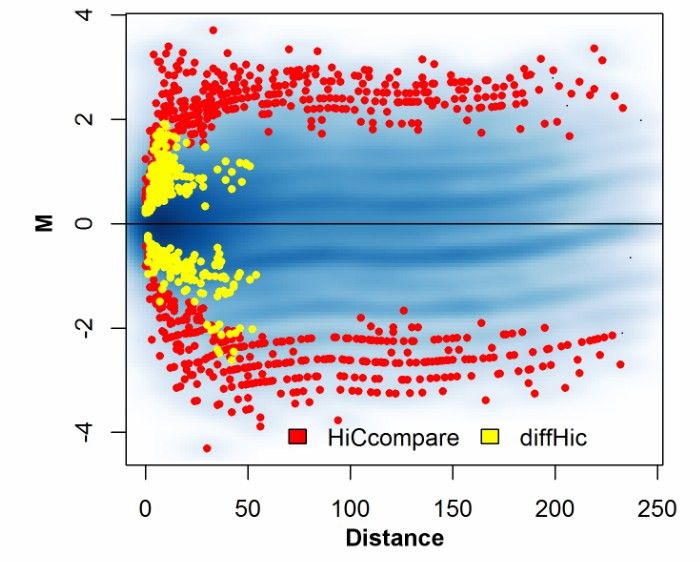 Comparison of regions detected by HiCcompare and diffHic (John et al., 2017)
Before Hi-C data analysis, the original data must be properly preprocessed. This includes removing low-quality reading segments, correcting PCR amplification deviation, and using appropriate normalization methods to reduce technical noise. It is very important to choose analytical tools suitable for specific research problems. For example, scHiHTools is a special computing toolbox for single-cell Hi-C data, which can deal with high-dimensional and sparse problems. In addition, FreeHiC provides a high-fidelity data enhancement method, which is suitable for benchmark testing and data enhancement. Integrating Hi-C data with other omics data (such as RNA-seq, ChIP-seq, etc.) can provide a more comprehensive genome view. For example, using R-packet OMICsPCA can integrate multiple omics data, thus improving the accuracy and robustness of analysis.
Avoid over-reliance on a single analytical method or tool. For example, although the Bloom method works well in some cases, it may not be able to capture all cis-regulatory scenarios. Therefore, it is suggested to combine various methods for analysis. Ensuring data quality is the key to successful analysis. For example, using HiCNorm tool can eliminate the deviation in Hi-C data. In addition, the use of high-quality reference genomes and cell lines can improve the accuracy of analysis, and the biological background must be considered when analyzing Hi-C data. For example, Hi-C data of different cell types and developmental stages may show different characteristics. Therefore, it is very important to choose the appropriate cell type and development stage to obtain meaningful results.
Hi-C data analysis is a complex and changeable process, which requires comprehensive consideration of data preprocessing, tool selection, multi-group integration, statistical modeling and data visualization. By following the above best practices and techniques, you can maximize the insight of Hi-C data and avoid common traps and mistakes.
Hi-C technology plays an important role in the study of the three-dimensional structure of genome. By measuring the interaction frequency between genome regions, the three-dimensional genome organization in the process of gene expression, DNA replication, cell division and DNA damage response is revealed. However, Hi-C data analysis faces many challenges, including data sparsity, noise and artifacts. In recent years, a variety of algorithms and tools have been developed to improve the analysis accuracy and efficiency of Hi-C data.
In the future, Hi-C technology will make further development in the following aspects. Optimize the Hi-C data analysis algorithm, especially in processing large-scale data sets and complex samples. Improve the resolution and accuracy of single cell Hi-C data, and solve the problems of data sparsity and noise. For example, scHi-CSim performs benchmarking by simulating high-fidelity single-cell Hi-C data. Through the comparison of Hi-C data across species, the conservatism and differences of chromatin structure between different species are revealed. For example, by comparing the Hi-C data of different species, the changes of chromatin structure during evolution are studied.
References
Terms & Conditions Privacy Policy Copyright © CD Genomics. All rights reserved.