

We use cookies to understand how you use our site and to improve the overall user experience. This includes personalizing content and advertising. Read our Privacy Policy
Accept Cookies
The rapid growth of the whole genome chromosome conformation capture data has brought great opportunities and challenges to the computational modeling and interpretation of the three-dimensional genome. High-throughput chromosome conformation capture (Hi-C) is a method to study the three-dimensional structure. Hi-C mainly takes the whole nucleus as the research object, uses high-throughput sequencing technology and biological information analysis method to study the spatial relationship of the whole chromatin in the whole genome, obtains a high-resolution interaction map of chromatin regulatory elements, and more comprehensively expounds the three-dimensional structure of chromatin. Similarly, Hi-C can be combined with RNA-Seq, ChIP-Seq and other omics data, and then the related mechanism of biological traits formation can be expounded from gene regulation network and epigenetic network.
Principle and steps of Hi-C technology
Formaldehyde immobilization: The first step of Hi-C technology is to use formaldehyde to coagulate the protein involved in chromatin interaction in the genome. Generally, living samples are treated with 1-3% formaldehyde at room temperature for 10-30 minutes. This step is very important for fixing the conformation of DNA.
Enzymatic digestion sequence: Next, the genome is cut by restriction endonuclease, and the size of the interrupted fragment will affect the sequencing resolution. Commonly used restriction enzymes, such as EcoR1 or HindIII, are used to cut the genome every 4000bp, resulting in about 1 million fragments in the human genome.
End repair: the obtained fragment has a flat end or a sticky end, and then the end is patched and repaired, and biotin is added.
Linking and de-crosslinking: T4 DNA ligase is used to connect the interacting fragments to form a loop. Protein of the linked DNA fragment is digested to obtain a cross-linked fragment.
Sequence interruption: Interrupt the fragment again by ultrasonic or other means.
On-line sequencing: Capture biotin with magnetic beads, make a library, and sequence it on-line.
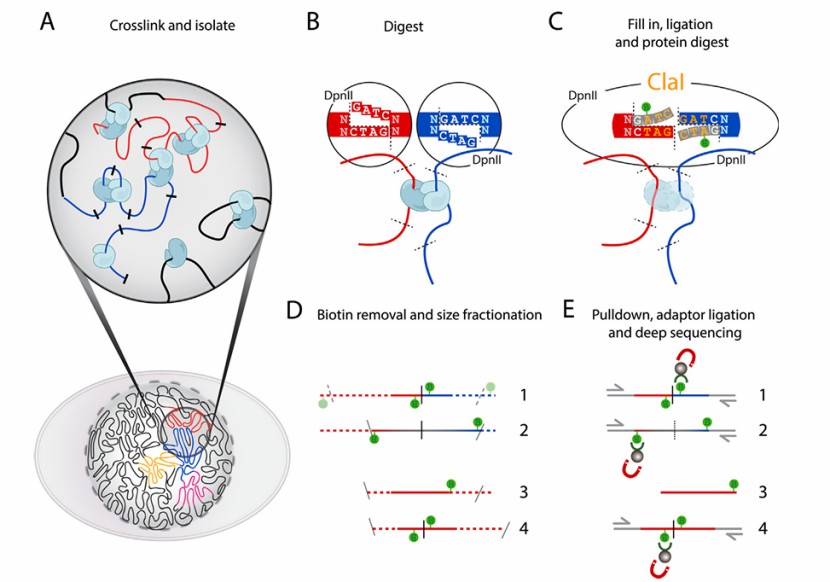 Overview of the Hi-C method (Houda et al., 2017)
Hi-C heatmap is a graphical representation method to show the interaction between different regions of chromosomes or genomes. It indicates the contact frequency or correlation between these regions by color coding, thus helping researchers to identify high interaction regions and potential biological functions in the genome.
Hi-C heatmap is specially used to display Hi-C experimental data. Hi-C experiment generates a matrix by measuring the physical contact frequency of chromosomes in the nucleus, in which each element represents the intensity of interaction between two genes or chromosome regions. These data are usually presented in the form of two-dimensional matrix, and different levels of interaction intensity are represented by color coding.
The core of Hi-C heatmap is a matrix, in which rows and columns respectively represent different regions in the genome. Each element in the matrix represents the interaction frequency or correlation value between two regions. Color coding is a key component of heatmap, which is used to represent the values in the matrix. Common color codes include the change from cool color (such as blue) to warm color (such as red), indicating the interaction intensity from low to high. For example, red may indicate high interaction and blue may indicate low interaction. The axis of a heat map usually represents the physical location of a genome or a specific region on a chromosome. These axes can help users locate and understand data in heat maps.
Service you may intersted in
In order to read Hi-C heatmap, it is necessary to understand its axis and color scale, and identify significant genomic interactions, such as topological related domains (TADs), loops and domains.
Understand axis and color scale
Axis: Hi-C heatmap usually has two axes, the horizontal axis and the vertical axis, which respectively represent the sequence or position of genome. Each point on these axes represents a chromatin fragment or locus. For example, the following heatmap shows the intensity of interaction between chromatin fragments, the horizontal axis and the vertical axis represent the different positions of chromosomes respectively.
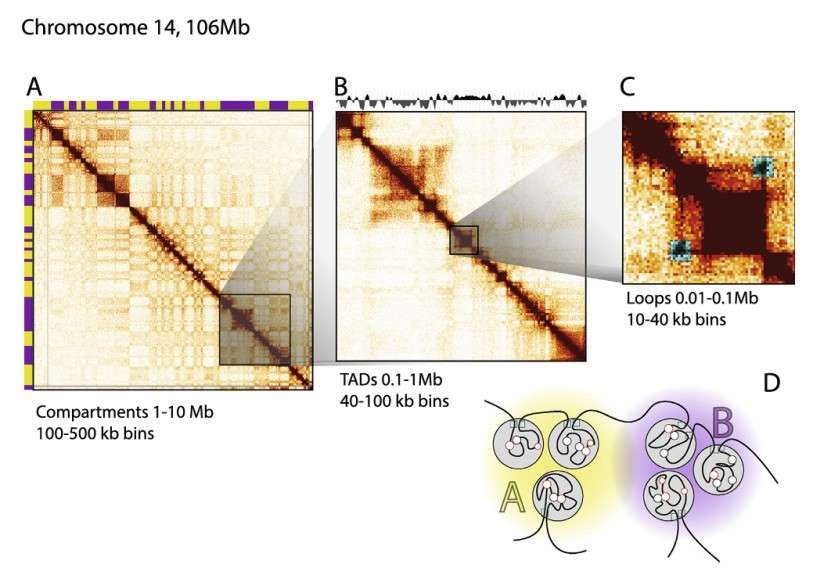 Heatmaps generated from 100 kb binned Hi-C data for chromosome 14 (Houda et al., 2017)
Color scale: Color scale is used to indicate the interaction of different intensities. Generally, darker colors (such as blue or green) indicate lower interaction intensity, while lighter colors (such as yellow or red) indicate higher interaction intensity. For example, as shown in the following heatmap, red indicates that the intensity of Hi-C interaction is high.
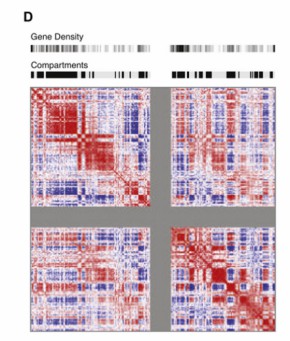 Red and blue plaid patterns show the compartmentalization of chr1 in two types of chromosomal domains (Belton et al., 2012)
Identify significant genomic interactions
TADs: TADs is a highly self-interacting region in chromatin, with less interaction with other regions. In heatmaps, TADs usually appear as high-density areas on the diagonal. TADs are contiguous regions that display high levels of self association and that are separated from adjacent regions by distinct boundaries. The locations of TADs can be determined when interaction data is binned at 40 kb or less.
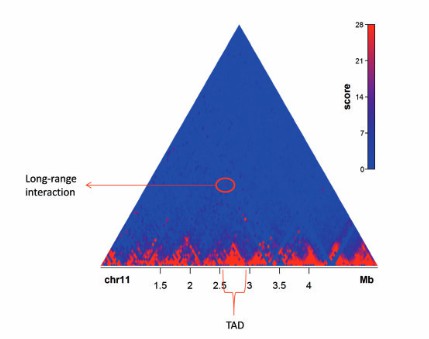 An example of a Hi-C contact map (Mora et al., 2016)
Loops: Loops are significant interaction points within chromatin or across regions. In the heatmap, many loops appear as off diagonal "dots" in a heatmap. Typically, a 10 kb resolution or higher is required for identifying looping interactions. Mapping to smaller bins will allow for more specific interactions, but this comes at the cost of a decreased number of reads per bin. Specific interactions between for instance pairs of CTCF sites are expected to show up as increased signal compared to their surrounding area.
Compartments: Compartments are defined as groups of domains, located along the same chromosome or on different chromosomes that display increased interactions with each other. In heatmaps generated from 100kb bins, this is visible as a specific plaid pattern. These alternating blocks of high and low interaction frequencies represent A and B compartments. Principal component analysis (PCA) readily identifies these compartments that tend to be cap tured by the first component. The active "A" compartments are gene-dense euchromatic regions, whereas the inactive "B" compartments are gene-poor heterochromatic regions.
Hi-C heatmaps is an important tool for analyzing chromatin interaction, which is mainly used to visualize the interaction frequency between different regions in the genome. Hi-C heatmap can be divided into the following types.
Contact Maps: It is the most common type of heat map in Hi-C data, which is used to show the interaction frequency between all regions in the genome. These heatmaps are usually presented in the form of a two-dimensional matrix, in which each cell represents the number of interactions between two genomic locations. High-value regions represent high-frequency interactions, while low-value regions represent low-frequency interactions.
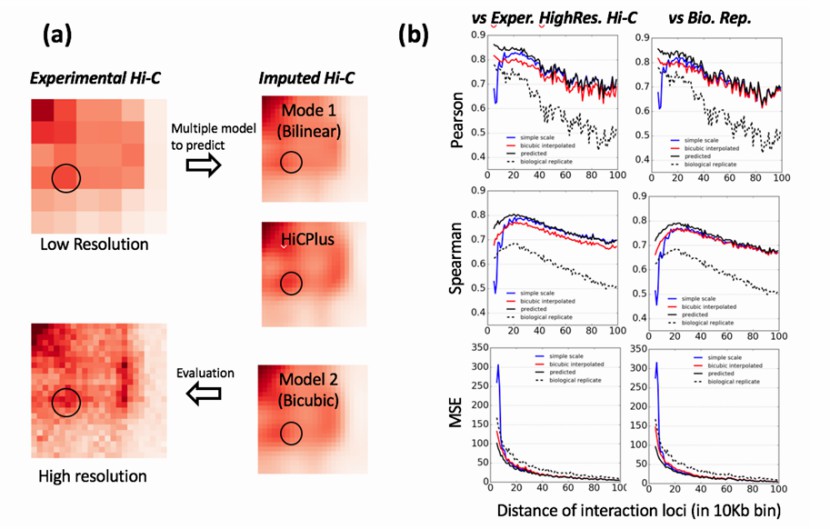 Imputed high resolution contacts are close to experiment data (Zhang et al., 2017)
Interaction maps: It is a variant of contact diagram, which is usually used to show chromatin interaction under specific experimental conditions. These heat maps can display the interactive data of multiple experiments for comparison and analysis.
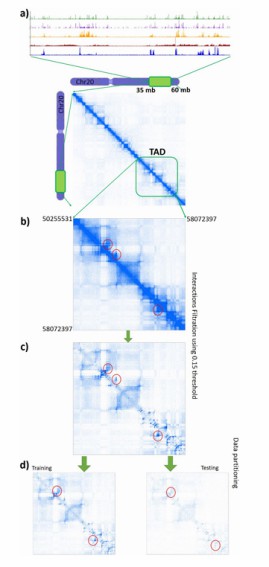 Heatmaps transformation for analysis (Bkhetan et al., 2017)
Heatmaps for different genomic regions: This type of heatmap focuses on the interaction between specific genomic regions (such as promoters, enhancers, etc.). For example, the capture of Hi-C by a promoter can generate a heatmap for a group of specific genomic regions, which are usually the key regions for gene expression regulation. In addition, the interaction patterns in specific chromatin domains (such as TADs) can be analyzed by heatmap.
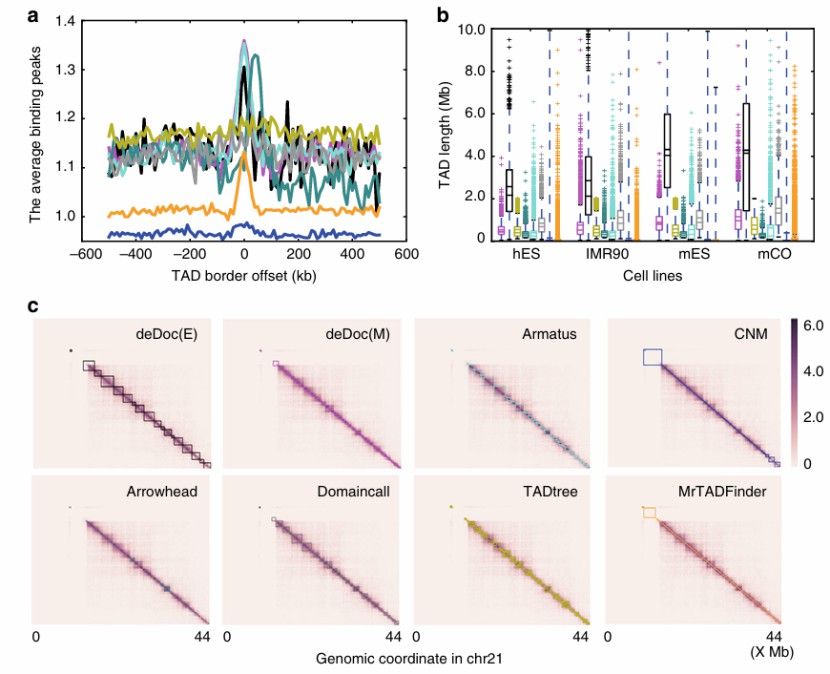 Heatmaps for analysing different genomic regions (Li et al., 2018)
High-resolution heatmaps: It shows chromatin interaction through finer-grained boxes (such as 25 kb or 1 kb), thus providing more detailed information on genome structure.
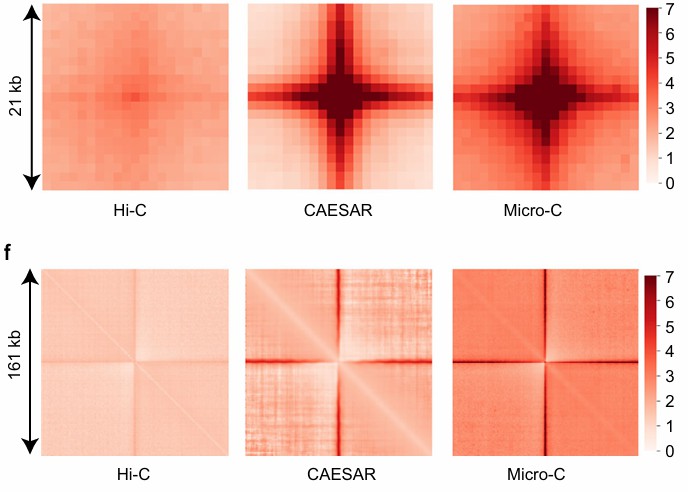 The venn diagram and pile-up visualization of the stripes (Feng et al., 2022)
Multi-condition comparative heatmaps: This heatmap is used to compare chromatin interactions between different conditions or different cell types. For example, Hi-C data of different cell types (neurons, astrocytes and oligodendrocytes) are displayed, and their similarities and differences are shown in the form of heatmap.
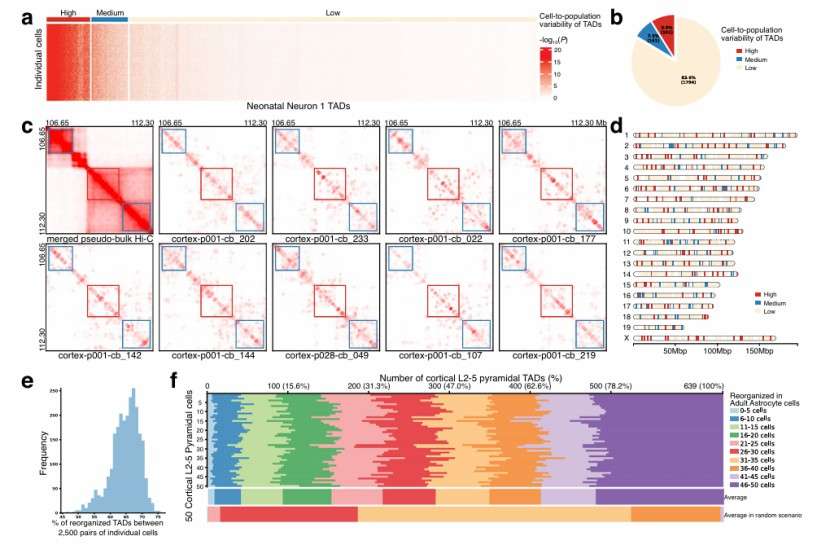 Application of scHi–C data to characterize cell-to population and cell-to-cell variability of TADs (Hua et al., 2024)
Analysis of Hi-C heatmap is an important means to study chromatin interaction and genome structure. The following are some commonly used tools and techniques, as well as their applications in thermal map analysis, common patterns and their biological significance.
Tools and techniques
Juicer: Juicer is a widely used tool for processing Hi-C data and generating heat maps. It provides a one-button system to analyze the Hi-C experiment of ring resolution. Juicer can load matrices in ".h5" format and support many normalization methods. It can also be combined with other tools such as Cooler to enhance the interactivity and visualization of heat maps.
HiCExplorer: HiCExplorer is an open source toolkit, which is suitable for the processing, normalization, analysis and visualization of Hi-C data. It provides many functions, such as extracting cross interaction, setting matrix resolution, merging duplicates, calculating Compartment Score, etc. HiCExplorer also supports TAD boundary detection and score feature difference analysis.
Cooler: Cooler is a tool for storing and visualizing large-scale Hi-C data, which supports multi-resolution and multi-file heat map display. It can be used in combination with Juicer to provide more flexible heatmap generation and analysis functions.
HiGlass: HiGlass is a web-based tool, which supports the dynamic arrangement and visualization of multi-scale contact diagrams. It can load multiple Hi-C dataset views and support synchronous visualization with other genome data (such as ChIP-seq).
Biological significance
The distribution of TADs and chromatin ring can reveal the regulation mode of gene expression. Long-range interaction and chromatin ring distribution are helpful to understand the process of chromosome restructuring, such as chromosome breakage and repair. Hi-C heatmap can reveal the differences of genome structure between different species and provide important clues for evolution and function research. In disease models, Hi-C heatmap can reveal abnormal chromatin interaction and provide a new perspective for understanding disease mechanisms. By using the above tools and techniques, researchers can efficiently analyze Hi-C data and reveal the complex patterns of the three-dimensional structure of the genome and its biological significance.
Learn More:
Hi-C technology is a high-throughput sequencing method, which is used to study the spatial relationship of chromatin DNA in the whole genome and generate a high-resolution interaction map of chromatin regulatory elements. The applications of Hi-C heatmap covers human genome research and cancer-related chromatin interaction.
Correction of Hi-C contact diagram of cancer cell line
In order to correct the Hi-C contact map in cancer cell lines, researchers developed the HiCNA framework. This framework integrates CNV information to generate high-resolution CNV-equalized contact map, thus reducing systematic deviation. This method is excellent in analyzing the chromatin interaction in breast cancer cell lines MCF7 and MCF-7.
Application of single cell Hi-C technology in cancer research
Droplet Hi-C technology is a single-cell level Hi-C method, which can analyze the cell type-specific chromatin structure in complex tissues. For example, in the study of mouse cortex and cancer cells, Droplet Hi-C reveals the structural variation and chromatin interaction in cancer cells, which provides important information for understanding tumor evolution and therapeutic response.
Application of Hi-C in cancer gene research
A study analyzed the changes of chromatin interaction in breast cancer cells mediated by E2 gene by Hi-C technology. The results showed that the frequency of chromatin interaction changed significantly before and after E2 treatment, especially in the high interaction region of chromosomes 17 and 20. These changes are closely related to gene expression regulation.
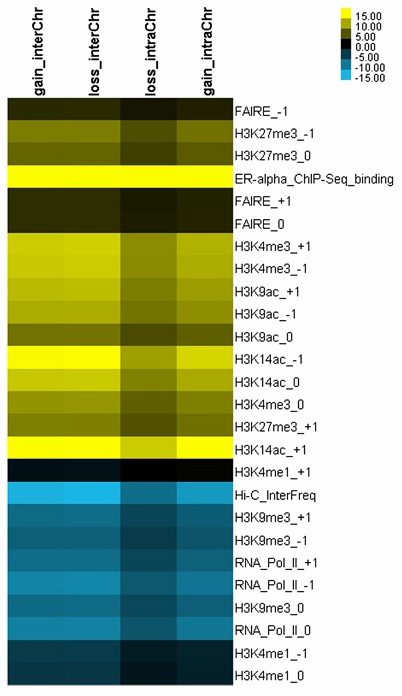 A heatmap of change of histone modifications (Wang et al., 2013)
Application of Hi-C in bacterial genome research
Hi-C technology is also used to study the bacterial genome structure. For example, in the study of OMM12 intestinal bacteria, Hi-C thermogram shows the complexity of bacterial chromosome folding, including bow signals and chromosome structures of different sizes.
Hi-C technology has demonstrated its powerful application potential in many fields, from human genome research to the analysis of cancer mechanism, and then to the exploration of bacterial genome structure. Hi-C technology provides an important scientific basis for understanding gene regulation, disease occurrence and treatment strategy through high-resolution chromatin interaction map.
As an important tool to study chromatin interaction, Hi-C heatmap should pay attention to several key points in its interpretation. The main diagonal represents the self-interaction of chromatin region, and its intensity is the basis for measuring other interactions. The checkerboard pattern in the heatmap reflects the compartmentalization of chromatin, in which the "A" compartment is rich in active transcription genes, while the "B" compartment is relatively inhibited. This compartmentalization pattern is closely related to the transcription state of cells, and its changes can be used as a sign of cell differentiation or disease state.
TADs appear as areas with frequent internal interactions and sharp decrease of interactions at the boundary in the thermal map. TADs play a key role in the regulation of gene expression by bringing together regulatory elements, and its structural changes may lead to gene expression disorder, which may lead to genetic diseases. In addition, the off-diagonal elements in the heatmap show the interaction between chromatin distant regions, which is very important for understanding how genes are influenced by regulatory elements with long linear distances.
When reading Hi-C heatmap, data normalization can not be ignored. Due to the differences in sequencing depth, experimental deviation and uneven DNA content, normalization is a necessary prerequisite for accurate analysis and comparison of chromatin interaction between different samples. In a word, Hi-C heatmap reveals the three-dimensional structure and interaction mode of chromatin for us. Through careful interpretation of various characteristics in heatmap, we can deeply understand the mechanism of gene regulation and provide important clues for the study of biological processes such as cell development and disease occurrence.
References
Terms & Conditions Privacy Policy Copyright © CD Genomics. All rights reserved.