


We use cookies to understand how you use our site and to improve the overall user experience. This includes personalizing content and advertising. Read our Privacy Policy
Accept Cookies
RNA acetylation (ac4C) is a key player in gene expression regulation, and acRIP-seq (acetylated RNA immunoprecipitation sequencing) is a top-notch technique for probing this modification genome-wide. This section lays out a streamlined pipeline for acRIP-seq data analysis, walking you through vital steps from start to finish: raw data processing, peak calling, and functional annotation.You'll learn the ropes of cleaning and mapping sequencing reads, a must for solid results. Then, it's onto detecting ac4C modification sites with tools like MACS2, zeroing in on crucial genomic spots.
Data visualization takes center stage too, with genome browser views, heat maps, and volcano plots transforming complex data into clear, digestible insights into RNA acetylation's biological roles.And for the big picture, we dive into merging acRIP-seq data with multi-omics data. This power move deepens our grasp of RNA acetylation in complex processes like cancer and cardiac ischemia, revealing how it meshes with other molecular players.
Whether researcher or bioinformatician, this guide arms you with the know-how to skillfully analyze and decipher acRIP-seq data, shedding light on RNA acetylation's gene regulation effects and broader biological significance.
Service you may intersted in
If you want to learn more about the acRIP-seq, please refer to:
RNA acetylation is a vital player in gene expression regulation, and acRIP-seq offers a robust way to examine this modification across the entire genome. This section outlines the essential acRIP-seq data analysis workflow, starting with raw data cleanup and mapping, then moving on to peak calling and functional annotation. It covers techniques for pinpointing ac4C modification sites and making sense of the findings with tools like MACS2. Plus, it underscores the value of data visualization for grasping the broader biological implications of RNA acetylation.
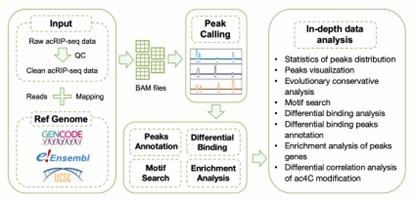 Bioinformatics Analysis Pipeline of acRIP-seq data
Raw data processing is a crucial step in the initial phase of acRIP-seq data analysis. First of all, the original reads obtained from sequencing need to be quality controlled, using tools such as FastQC to check the base quality, sequence length, GC content and other indicators of the data to ensure the reliability of the data. Subsequently, low-quality reads, splice sequences, and possible contaminants are removed, and the data are preprocessed using software such as Cutadapt or Trimmomatic to improve the accuracy of subsequent analyses. Particularly important during preprocessing is the removal of splice sequences. Trimmomatic can remove low-quality bases and splice sequences by dynamic trimming or fixed cropping to ensure the accuracy of subsequent analysis.
Next, reads were mapped to a reference genome (e.g., human genome hg19) using a tool such as Tophat2 and optimized by specifying the following parameters: 1) report up to one match per read (-g 1); 2) allow up to five mismatches per read (guaranteeing greater than 95% matches); 3) perform post-match filtering using the Ensembl Release 75 gene annotation information; and 4) perform post-ratio filtering to remove mitochondrial DNA (chrM) and non-consistent pairs from the results.
In this process, region-specific alignment can also be performed, such as using Bowtie2 to align reads to the experimentally added murine β-globin probe sequences as well as to the 43 kb-long human ribosomal DNA repeats (GenBank U13369.1), specifically to analyze reads from these features.
Peak Calling is a key step in identifying ac4C modification sites with significant enrichment in acRIP-seq data. There are various algorithms and software available for Peak Calling, such as MACS2, HOMER, etc. These tools identify significant Peak regions by evaluating the enrichment of each region through statistical methods such as negative binomial distribution or Poisson distribution modeling and comparing it to the background level.
In practice, when using MACS2 for peak calling, particular attention needs to be paid to its parameter settings to accommodate the characteristics of the transcript comparison data. It is recommended to turn off the site-shift model (-nomodel) and the local lambda model (-nolambda) and to use the transcript reference genome size (specified via the -gsize parameter). In addition, input samples should be used as controls for peak calling to improve identification accuracy.
To ensure the reliability of the identification results, the data can be rigorously filtered: (1) First, compare the signal intensity of ac4C peaks in NAT10-/- cells (no acetylation control) and extract the pileup values in the MACS2 output by the bedtools map function, filtering out the peak summits with higher pileup values in parental cells than in the NAT10-/- cells. (2) Remove peaks that may be caused by non-specific IgG binding, and retain peaks with no coordinate overlap by intersection analysis with peaks in IgG-IP experiments. (3) Ensure consistency of peaks detected in replicate experiments by requiring that peaks in pooled data are identical to the peaks in the individual replicates. peaks in the pooled data were required to overlap with peaks in the individual replicates. (4) Mapping errors were ruled out by manually checking the comparison results to confirm whether the peak calling was consistent with the results of the genomic comparison.
Service you may intersted in
Functional annotation of the identified ac4C-modified Peak is a key step in understanding its role in gene expression regulation. The annotation not only includes information about the location of the Peak in the genome, such as exons, introns, promoter regions, etc., but also allows further analysis of its potential function in gene expression regulation. For example, potential mechanisms of action of ac4C modifications in transcriptional regulation can be hypothesized by association analysis with known genes, transcription factor binding sites, chromatin accessibility regions, etc. In addition, GO enrichment analysis and KEGG pathway analysis can be performed using tools such as the DAVID database to reveal the functions of ac4C-modified genes in biological processes and the signaling pathways involved.
Data visualization is the process of presenting complex data information in an intuitive, easy-to-understand way that helps researchers better interpret and understand acRIP-seq data. Common visualizations include genome browser visualizations, heat maps, and volcano maps.
Utilizing tools such as UCSC Genome Browser or IGV, the ac4C modification Peak can be displayed overlaid with genomic features, transcriptomic data, etc., to visualize the distribution of the Peak in the genome and its correlation with gene expression. For example, the Genome Browser allows you to clearly see the enrichment of the ac4C modification in the exonic region of a specific gene and its correlation with the expression level of that gene.
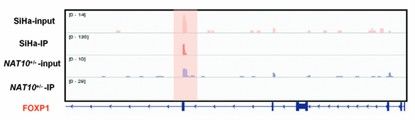 IGV plot of acRIP-seq showing ac4C peaks (Chen et al., 2023)
Heatmaps showing changes in ac4C modification levels across samples or under different conditions allow rapid identification of modification sites with significant differences. Heatmaps can visualize similarities and differences in ac4C modifications across multiple samples, helping to identify potential biological patterns. For example, in cancer research, heatmaps can be used to compare ac4C modification patterns across different cancer types or under different treatment conditions, thereby unearthing modification sites associated with disease progression.
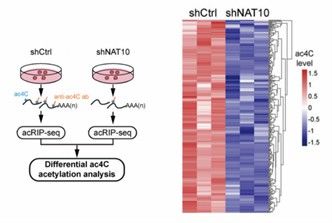 Heatmaps of 125 transcripts displaying reduced ac4C peaks (Liu et al., 2024)
Volcano plot is used to show the statistical significance and effect size of ac4C modification sites, the horizontal axis of the volcano plot indicates the logarithmic multiplicity of change, and the vertical axis indicates the statistical significance (e.g., p-value), which can clearly show the Peak of the significant difference. volcano plots can help researchers to quickly filter out the ac4C modification sites with significant differences, which can provide the basis for further functional studies and experimental validation.
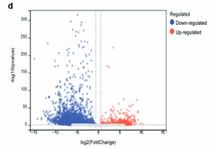 Volcano plot showing the change inthe ac4C level on mRNA (Chen et al., 2023)
By identifying conserved sequence patterns (motifs) in the Peak region of the ac4C modification, it is possible to infer the binding sites of transcription factors or other regulatory proteins. Comparison of the identified motifs with known transcription factor binding sites can reveal potential mechanisms of ac4C modification in transcriptional regulation. For example, the presence of conserved sequences in certain ac4C-modified Peak regions that bind to specific transcription factors suggests that these modification sites may regulate gene expression by interacting with transcription factors.
 The ac4C motif detected by MEME motif analysis (Chen et al., 2023)
Through these visualization tools, researchers can dig deeper into the biological information in acRIP-seq data, and combine it with experimental validation to further elucidate the role of RNA acetylation modification in life activities. For example, in the study of cardiac ischemia/reperfusion injury, by visualizing and analyzing the acRIP-seq data, researchers found that the NAT10/Mybbp1a/p53 axis plays a key role in regulating iron death in cardiomyocytes.
Beyond standalone acRIP-seq studies, researchers are increasingly turning to multi-omics approaches to unravel the biological intricacies of RNA acetylation. In this section, we'll delve into the crucial steps for preprocessing and integrating multi-omics data, with acRIP-seq taking center stage. To lay a solid foundation, we meticulously preprocess, normalize, and quality control each data type—be it transcriptome or proteome—ensuring consistency and reliability. Next, we explore correlation and co-localization analysis techniques, which shed light on how RNA acetylation modification intertwines with gene expression and protein function. Network-based integration emerges as a potent strategy, weaving together diverse omics data to unveil regulatory networks and signaling pathways. Real-world case studies showcase the transformative power of combining acRIP-seq with RNA-seq, proteomics, and other omics data, propelling our understanding of complex biological processes and disease mechanisms, from cardiac ischemia to cancer.
Before integrating acRIP-seq data with multi-omics data, pre-processing of the individual histologies is required to ensure comparability and consistency of the data. For transcriptomic data (e.g., RNA-seq), quantitative analyses are needed to obtain the expression of genes or transcripts and normalize them. For proteomic data, protein abundance needs to be quantified and processed with missing value filling and data normalization. In addition, quality control of each histology data is required to remove outliers and noisy data to improve the accuracy of the subsequent integrated analysis.
Correlation analysis is an important method to assess the degree of association between different histologic data. By calculating the correlation coefficients (e.g., Pearson's correlation coefficient, Spearman's rank correlation coefficient) between ac4C modification sites identified by acRIP-seq and gene expression, protein abundance, and other data, we can discover potential links between RNA acetylation modifications and gene expression regulation and protein function. For example, it was found that NAT10-mediated ac4C modification enhances the stability of Mybbp1a mRNA, which in turn affects p53 activation and expression of related genes. Co-localization analysis is used to determine the spatial distribution of different histological data on the genome, such as comparing the ac4C modification Peak with chromatin-accessible regions (e.g., ATAC-seq data) and histone-modified regions (e.g., ChIP-seq data) to search for co-localized regions, which can reveal the synergistic effect of RNA acetylation modification with other epigenetic regulatory mechanisms.
Constructing multi-omics networks is one of the effective means to integrate different histologic data. Gene-protein-metabolite networks can be constructed to associate ac4C-modifying genes identified by acRIP-seq, key proteins in proteomics data, and metabolites in metabolomics data, and analyze the interactions among different histologies using the network topology. For example, through co-expression network analysis, other genes co-expressed with ac4C modification genes can be identified, and thus their potential functional modules and signaling pathways can be inferred. In addition, network analysis methods, such as module identification and key node analysis, can be utilized to mine key regulatory factors and core regulatory networks in multi-omics data, providing new perspectives for understanding the role of RNA acetylation modifications in complex biological processes.
The power of acRIP-seq to integrate with multi-omics data has been demonstrated in several cases in real-world studies. For example, in the study of cardiac ischemia/reperfusion injury, the integration of acRIP-seq, RNA-seq, and proteomics data has revealed the critical role of the NAT10/Mybbp1a/p53 axis in regulating iron death in cardiomyocytes. In addition, in cancer studies, the combination of acRIP-seq and RNA-seq data revealed that NAT10-mediated ac4C modification can regulate the expression of multiple tumor-related genes, which in turn affects the proliferation, invasion, and metastasis of tumor cells. These cases show that the integration of multi-omics data can provide important clues and evidence to reveal the complex mechanisms of RNA acetylation modification in disease development.
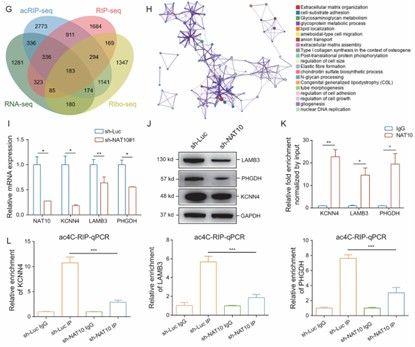 Multi-omics combination to verify NAT10 function (Feng et al., 2022)
Service you may intersted in
While acRIP-seq data analysis and multi-omics integration have come a long way, they still face hurdles. In this section, we tackle the main challenges and future prospects in these areas. On the technical front, it's tough to tease apart faint ac4C signals from background noise, track RNA acetylation's shifting patterns across various cell types and conditions, and fully grasp ac4C's biological roles. Computationally, we're up against the daunting tasks of storing massive datasets and grappling with intricate analytical methods during multi-omics integration. But the future looks bright. Breakthroughs in sequencing tech and data processing—think single-cell acRIP-seq and deep learning—are set to revolutionize the field. They'll enable sharper analysis and smoother data integration, paving the way for major strides in disease research, drug development, and personalized medicine.
Analyzing acRIP-seq data isn't without its hurdles. For starters, ac4C modifications are pretty scarce on RNA, making it a real head-scratcher to tell the genuine signals apart from the noise in the sequencing data. This muddies the waters when it comes to getting accurate and sensitive results in peak calling. And then there's the fact that RNA acetylation isn't static—it shifts and changes depending on the cell type, what stage of development it's at, or even the physiological state. So, figuring out how to track and analyze these ever-changing patterns is a tall order. To top it all off, we're still in the dark about what ac4C modifications actually do and how they pull the strings in terms of regulation. That means we're flying blind when it comes to guiding data analysis and making sense of the results.
When it comes to blending multi-omics data, it's like trying to juggle a bunch of different data types and complex analysis methods, all while needing a supercomputer and some fancy algorithms to keep up. The data we're dealing with is massive, so storing and moving it around takes up a ton of space and bandwidth. Plus, the math behind integrating and analyzing it all is no walk in the park—think building networks or training machine learning models. You need some serious computing power and finely-tuned algorithms to make it happen. And then there's the issue of all the different data types not playing nice together. Figuring out how to merge them effectively, despite their differences, is a big challenge.
Looking ahead, acRIP-seq data analysis and multi-omics integration are set to get a major upgrade as tech keeps advancing and research digs deeper. On the tech side, we'll see new sequencing tricks and data processing tools popping up. Single-cell acRIP-seq, for instance, could give us super-detailed RNA acetylation profiles, letting us study how cells vary from one another. And deep learning could help us dig up hidden patterns and connections in multi-omics data. As for applications, these techniques will spread their wings in disease research, drug discovery, and precision medicine. Imagine combining acRIP-seq with clinical and genetic data to get a full picture of how RNA acetylation affects diseases, opening up fresh avenues for diagnosis and treatment.
References
Terms & Conditions Privacy Policy Copyright © CD Genomics. All rights reserved.