When presented with an amplicon sequencing report, one may find themselves overwhelmed by the abundance of data and analyses contained within the document. With so much information, it can be challenging to discern which elements are truly informative. However, rest assured that the following sections will provide a detailed interpretation of the report's contents.
The standard analysis report typically includes four key components: (1) data quality control and acquisition of Amplicon Sequence Variants (ASVs); (2) an overview of the microbial community composition; (3) comparisons between different experimental groups and differential species analysis; and (4) predictions of the functional potential of the microbial community.
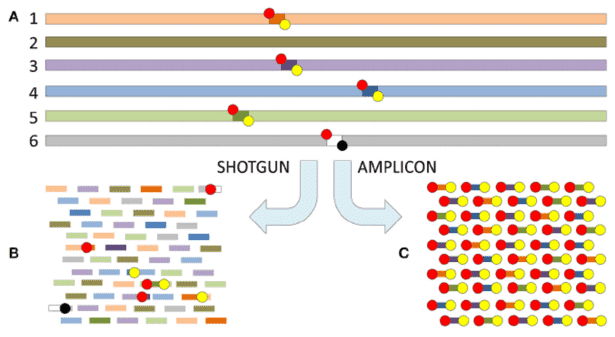
Data Quality Control and Acquisition of Amplicon Sequence Variants (ASVs)
The initial step involves the implementation of stringent quality control measures on the raw sequencing data to ensure the accuracy and reliability of subsequent analyses. Following this, clustering techniques are employed to generate Amplicon Sequence Variants (ASVs), which are then compared against reference databases for species identification and annotation. This results in the generation of a feature table, which contains species-specific characteristics for each sample.
The primary objective of this section is the construction of a comprehensive feature table that integrates species annotations with corresponding abundance data. This table serves as the foundation for all subsequent analyses.
This section primarily presents the structural composition of the microbial communities within the samples, encompassing species abundance distributions and various indices of alpha diversity. Typically, species abundance distribution is represented by bar stacked plots, which display the top 20 species ranked by relative abundance at different taxonomic levels (phylum, class, order, family, genus, and species). While bar plots are the most commonly employed method, alternative visualizations, such as heatmaps and clustered stacked plots, may also be utilized.
Through the species abundance bar plots, researchers can quickly identify the dominant species within a sample and compare the differences in species abundance across various samples. Given the vast number of undiscovered and unsequenced microbes present in the environment, coupled with the relatively low resolution of second-generation sequencing technologies at the species level, analyses are typically performed at the phylum and genus levels to maximize the clarity and relevance of the findings.
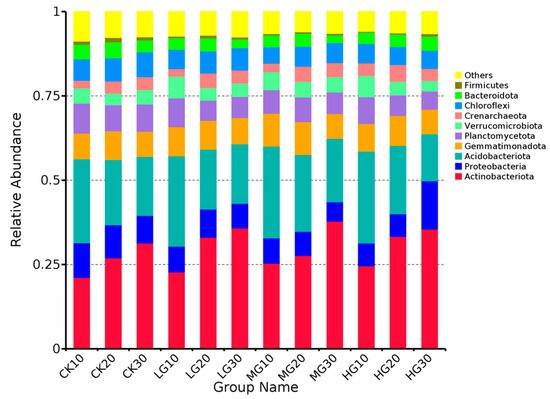 Relative abundance of dominant bacterial phyla
In the results file, species abundance distributions are also provided, organized by experimental group.
Venn Diagrams and Upset Plots
Some reports also include Venn diagrams (or Upset plots when more than five groups are involved), which provide a clear, visual representation of the species unique to or shared among the groups. These graphical representations facilitate the comparison of the overlap and differentiation in species composition across the experimental groups, enhancing the interpretability of the data.
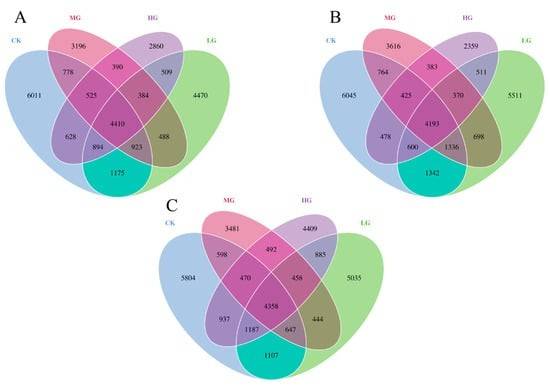 Venn diagrams showing the distribution of prokaryotic microorganisms
Alpha Diversity
Alpha diversity quantifies the species diversity within a community, encompassing both species richness and evenness. Several commonly used indices for measuring alpha diversity are presented in the report. Higher index values typically indicate greater species diversity within the sample.
When selecting which indices to include in a study, researchers should consider the specific objectives of the research and the desired analytical outcomes. For instance, if the focus is on the total number of species, indices such as Chao1 or the observed feature count may be appropriate. In contrast, if both species richness and evenness are of interest, the Shannon or Simpson indices are often preferred. Alternatively, researchers may choose to include only those indices that demonstrate significant differences across the groups.
Intergroup Comparison and Differential Species Analysis
In microbiome research, the primary focus often lies in examining the differences in microbial communities between various groups, along with identifying the specific taxa responsible for these differences, to facilitate further analysis and investigation.
Beta diversity provides insight into the dissimilarities between samples or groups. Analytical methods such as Principal Coordinates Analysis (PCoA), Non-metric Multidimensional Scaling (NMDS), and Partial Least Squares Discriminant Analysis (PLS-DA) are commonly employed to visually assess within-group reproducibility and inter-group differences. In these visualizations, a smaller distance between two points indicates a higher degree of similarity, while a greater distance reflects a more pronounced dissimilarity.
Differential testing methods, such as Adonis, ANOSIM, and MRPP, are utilized to evaluate the statistical significance of the differences between groups, typically based on p-value assessments. The report includes multiple beta diversity analysis techniques. Given that different distance metrics and dimensionality reduction models may yield varying results, researchers should select the most appropriate methods that align with the specific objectives of their study. In most cases, one or two analytical approaches are sufficient. For example, combining PCoA with ANOSIM analysis can help determine whether significant differences exist between microbial communities across treatment groups.
Metastats and LEfSe analyses are both employed to identify species with significant differences in abundance across different groups. Metastats is primarily used for pairwise comparisons, while LEfSe is designed for analysis involving multiple groups. LEfSe offers the advantage of performing multi-group comparisons across all taxonomic levels, and its Linear Discriminant Analysis (LDA) bar plots provide an intuitive representation of the results. Due to these features, LEfSe is widely utilized in this study.
In the resulting plots, different colors represent species identified as differentially abundant across various groups. These species may serve as potential biomarkers for subsequent research.
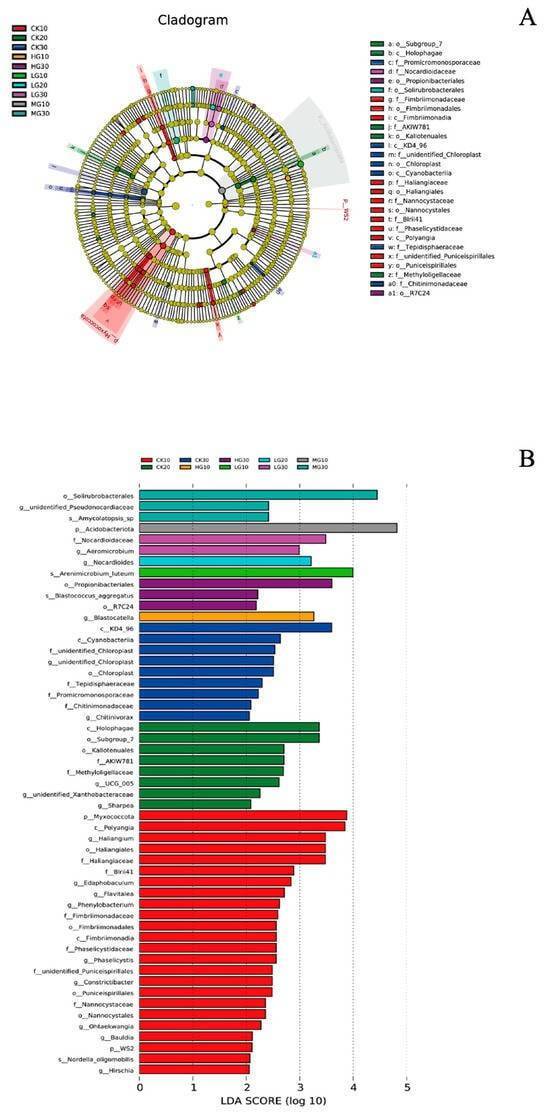 Phylogenetic and indicator taxa analysis of soil bacterial communities
Microbial Community Function Prediction
By associating microbial taxonomic information with functional databases, it is possible to uncover potential functions such as metabolic pathways, ecological roles, and phenotypic traits. Functional prediction is performed using widely adopted tools, including PICRUSt2, Tax4Fun, FAPROTAX, and BugBase.
Cluster heatmaps of functional annotation visually highlight the differences in functional abundances across samples, while STAMP analysis plots reveal significant differences in KEGG metabolic pathways between groups. These analyses provide insights into key pathways influencing the overall microbial community and the functional roles of differential microbes.
In practical analysis, the choice of prediction tool should be guided by the specific research questions. For example, PICRUSt is more suitable for predicting metabolic functions in gut microbiota studies, whereas FAPROTAX is better suited for predicting ecological functions in environmental samples.
Conclusion
The analyses presented in this manuscript represent some of the most commonly encountered results in microbiological studies. A variety of visualization formats and analytical methods have been provided, enabling readers to select the most appropriate approach based on their specific research needs. To extend the scope of the analysis, further in-depth studies may be conducted, such as the integration of metabolomic data with microbiome analysis, or the correlation of physiological/physicochemical parameters with microbial communities.
Reference
-
Wang, Y.; Ju, X.; Wu, Q.; Han, G. Effects of Grazing Intensity on Microbial Diversity at Different Soil Depths in Desert Steppe Soils. Agronomy 2025, 15, 124. https://doi.org/10.3390/agronomy15010124