


We use cookies to understand how you use our site and to improve the overall user experience. This includes personalizing content and advertising. Read our Privacy Policy
Accept Cookies
DNA methylation is related to transcription regulation, genome imprinting, stem cell differentiation, embryonic development and inflammation. Abnormal DNA methylation may reveal disease states, including cancer and nervous system diseases. Therefore, the distribution and locus of 5- methylcytosine (5mC) in human genome is an important research direction. Whole-genome bisulfite sequencing (WGBS) is a Qualcomm method for analyzing DNA methylation. WGBS, covers three steps: library preparation, sequencing comparison and quality control. However, different protocols will lead to deviations, so beginners' guide and data analysis guidance are needed.
The WGBS workflow commences with the extraction of high-quality genomic DNA from biological specimens using optimized methods like phenol-chloroform extraction or silica gel column adsorption, tailored to the sample type. The extracted DNA then undergoes bisulfite treatment, where precise control of reaction parameters (temperature, time, and bisulfite concentration) is critical to achieve efficient conversion and maintain DNA integrity. Library construction involves flattening the DNA fragment ends, appending an A-tail, and ligating sequencing adaptors, followed by PCR amplification to enrich the library. Subsequently, the library is sequenced on a high-throughput platform (e.g., Illumina), with sequencing depth and coverage being key determinants of data quality.
Library preparation
Methods Classification: Pre-bisulfite and post-bisulfite, the former needs a lot of initial DNA, and the latter can protect DNA from fragmentation. In addition, there are some special methods, such as PBAT and EM-seq, which have their own advantages and disadvantages and applicable scenarios.
Commonly used protocols, such as Accel-NGSMYL-SEQ, TruSeq, SPLAT, have different performances in CpG locus detection and genome coverage, so they should be selected according to their needs.
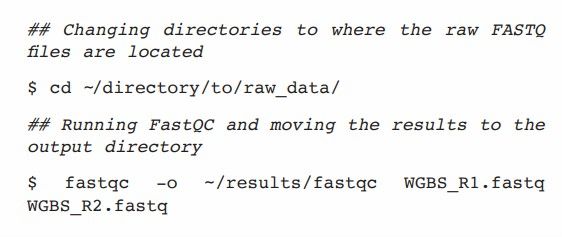
Data processing flow
Quality evaluation and pruning: Use FastQC to evaluate the quality of the original FASTQ file. WGBS data has unique quality problems. Trim Galore and other tools are used to remove low-quality bases and linker sequences during pruning to ensure the comparability of data.
Comparison and quality control: The comparison faces the challenges of C-T asymmetry and sequence complexity reduction. There are two comparison methods, three-letter and wildcard. Different comparators have differences in speed, accuracy and memory consumption, so they need to be considered comprehensively. After comparison, the quality was checked by M-bias diagram, and the deviation sources such as bisulfite-mediated degradation were treated.
Methylation extraction: MethylDackel is recommended to extract methylation information, and the methylation level is determined according to the comparison between sequencing and reference genome. Technical deviation should be checked and handled before extraction.
Data normalization and statistical analysis
CpG methylation: library preparation affects CpG coverage, and bedGraph downsampling can balance data before detecting differentially methylated regions.
DMRs: Many softwares use different methods to detect DMRs, such as BSmooth and BiSeq, which need to be normalized and covariate adjusted due to data characteristics.
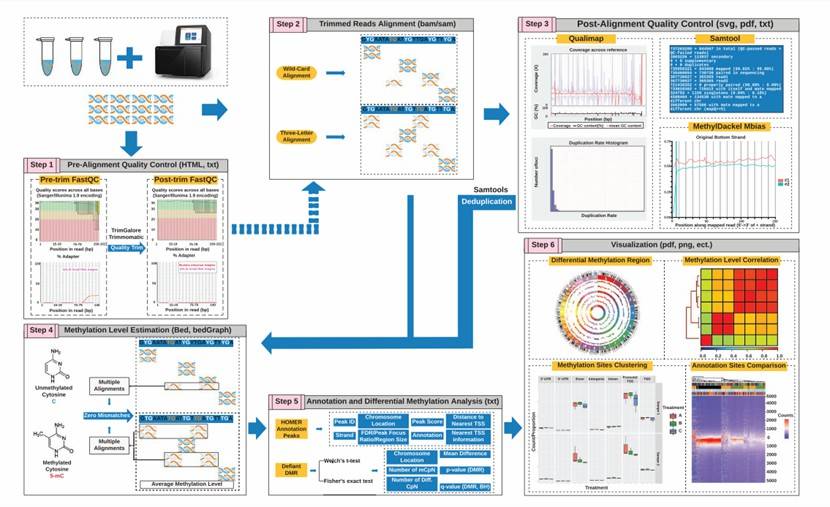 Outlines and principles of WGBS data processing and analysis pipeline (Gong et al., 2022)
Service you may intersted in
If you want to learn more about the WGBS, please refer to:
Pre-comparison quality assessment ensures the correct input of original data and improves comparability. Multidimensional evaluation examined low-quality reads, linker sequences, contaminated sequences and repeated reads. Synthetic sequencing (increasing the number of bases sequenced) will reduce the quality, especially on Illumina platform. During the sequencing process, a single molecule in a DNA cluster may not be successfully synthesized. Missynthesized molecular clustering will lead to motif calling errors, which are positively related to fragment length. The higher proportion of long fragments in library construction may lead to more calling errors, lower Phred score and higher mismatch rate, especially for paired end alignment. It is suggested to keep the bases with mass fraction ≥30, which means that the accuracy of motif calling is 99.9%.
The reading length of DNA sequencing reaction is usually longer than that of DNA fragment, and the linker sequences at both ends of the fragment may be wrongly sequenced, which will introduce constructive methylation C and cause deviation in subsequent methylation calling, so it is suggested to check and trim the linker in advance. The data may be contaminated, including primers and vector sequences added in the library preparation step, and Phi X phage DNA added to calibrate the sequence quality in the sequencing reaction. Over-expressed pollutants usually show a depth significantly higher than the readings of the nuclear genome, which reads to failure in the comparison process.
When the same DNA fragment is counted twice, repeated reads (two reads with the same gene locus) may occur. Long inserts may benefit from a higher proportion of high-quality reads, less linker contamination and higher effective reads depth (increasing genome coverage efficiency). The preparation of TruSeq library needs to pay special attention to repeated reads, and the number of cycles amplified by PCR is about twice that of Accel (10-12 cycles compared with 6-9 cycles).
 Raw FASTQ quality of the two samples reads was measured (Gong et al., 2022)
It is suggested to use FastQC to evaluate the quality of the original FASTQ file before and after pruning. QC results include an abstract in. HTML format and a. zip folder containing quality charts. The total number of reads, the sequence quality of each base and the linker detection map of each sample were detected to ensure good quality comparison and comparison of the number of reads. The bias of GC ratio and content distribution was observed during sulfite transformation. The pruned FastQC report was used as a double guarantee to ensure that the total number of reads of each sample remained unchanged after pruning (removing the linker) and to ensure the change of base sequence caused by random primers.
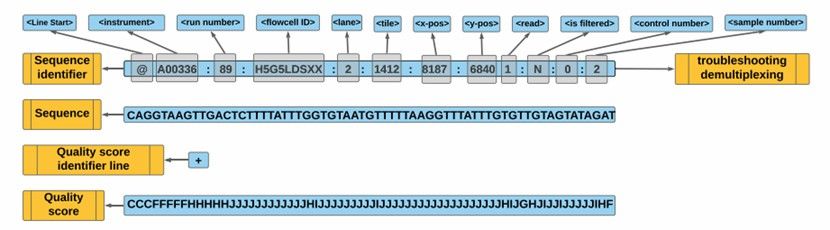 FASTQ file elements (Gong et al., 2022)
After evaluating the quality of the original FASTQ file with FastQC, Trim Galore software (with simplified command lines and parameters, which can automatically identify technical sequences) and Trimmomatic software can be used to remove low-quality Reads, splice sequences, contaminated sequences and repeated sequences. This step is called Trimming. There are two main aspects of WGBS data pruning: quality pruning and joint removal. Quality pruning focuses on the quality degradation of the original reads and the head and tail deviation of the sequence composition. Pruning methods include pruning areas below a specific quality threshold (the default score of Phred is 20, which means that 1/100 of the bases may be wrong), or pruning a self-defined number of bases from the beginning and end of reads.
For non-sulfite sequencing, linker removal depends on "over-expressed sequences" and "GC content of each sequence". Because CG content is not suitable for WGBS data, over-represented sequences are usually detected in Trim Galore as indicators of joint pollution. Other considerations of pruning parameters are library orientation and paired/single-ended characteristics of input reads. Trim Galore's default settings for the library are directional, and the characteristics of paired ends should be specified in Trim Galore to keep paired reads for further comparison. A warning will be triggered if the number of reads of two files does not match and the names of reads do not match.
WGBS is to convert unmethylated cytosine (Cs) into thymine (Ts) through sulfite treatment, while retaining methylated Cs. Ideally, unmethylated Cs can be identified when the reads sequence is aligned to the reference genome. However, sulfite transformation brings two computational challenges to data alignment: mismatch of C-T alignment and reduction of sequence complexity. C-T mismatch means that in sequencing reads, T may be aligned with C in the reference genome, and vice versa. The reduction of sequence complexity makes it difficult to distinguish the transformed Ts from system errors, which exaggerates the inaccuracy of comparison.
In order to solve the mismatch between reads and reference genome caused by this change, there are two main alignment strategies: three-character strategy and wildcard strategy. The three-character strategy simplifies the four-character-based genome to a three-character-based genome by converting all Cs in the reference genome and sequence reads into Ts. After that, the standard comparison tools are used to process the reads sequence, such as Bowtie1 or Bowtie2, BWA mem and GEM3, and the Burrows-Wheeler Transform (BWT) backtracking algorithm is mainly adopted. However, the wildcard strategy converts Cs in the genome into Ys, which can be matched with Cs and Ts in the reads sequence.
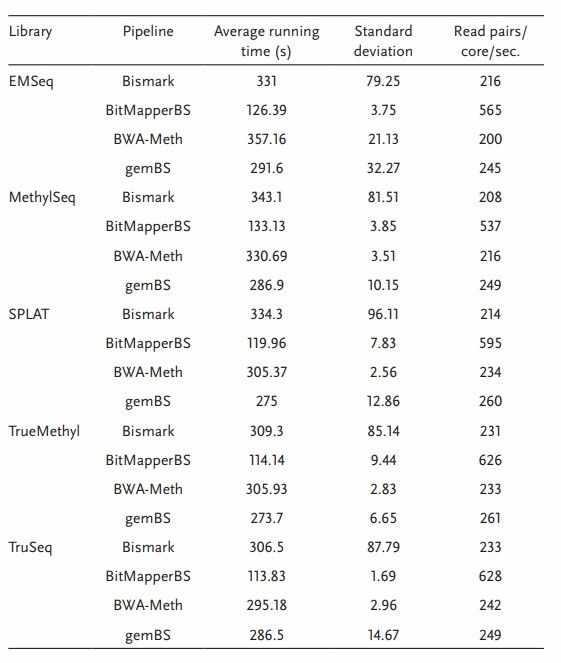 WGBS alignment algorithms comparison in speed (Gong et al., 2022)
When choosing a comparison tool, the accuracy of comparison and calculation time are the main considerations. Bock suggested that the wildcard alignment strategy achieved higher genome coverage, but increased the possibility of high methylation level evaluation bias, while the three-character strategy was the opposite. Wildcard alignment software keeps Cs in BS-transformed reads, and improves the sequence complexity to ensure the unique alignment with the reference genome, while three-character alignment software removes Cs in BS-transformed reads, which reduces the sequence complexity and increases the chance of fuzzy alignment.
However, the coverage difference and M-deviation only appear in the highly similar regions of the genome, so they are not very relevant in the long sequence reads alignment of the human genome. Therefore, computing speed and memory consumption are given priority in the selection of comparison software. Research shows that three-character comparison software such as Bismark and BWA-METH is superior to wildcard comparison software such as BRAT_BW, BSMAP and GSnap in running time and peak memory usage.
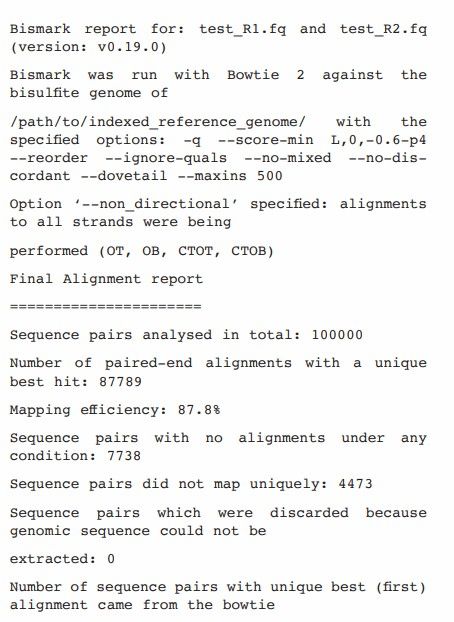 The best alignments came from OT and OB (Gong et al., 2022)
Among many comparison softwares, BitMapperBS and FMtree are relatively more time-saving, but compared with Bismark, BWA-METH and gemBS comparison softwares, 6-7 times of calculation time reduction is not observed on 1,000,000 bp paired terminal analog data read. For those who deal with large mammal sequencing projects, it may be convincing to reduce it from about 24 hours to 7-8 hours, although the quality of comparison may be sacrificed in the pursuit of speed.
BitMapperBS may not be able to guarantee the highest quality comparison in the case of multiple mismatches, so the author recommends Bismark, BWA-METH and gemBS, which can save about one third of the running time and balance the relationship between running time and comparison quality.
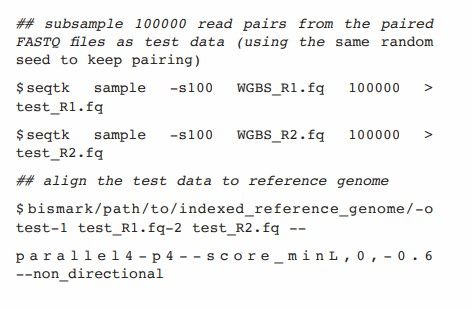 A pair-end direction test of the data (Gong et al., 2022)
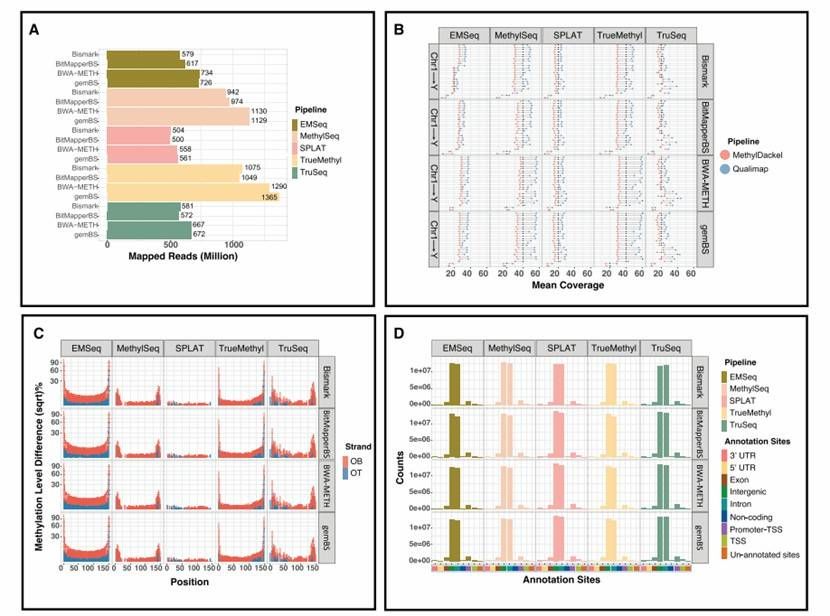
The difference in running time and comparison quality of the reads alignment algorithm used for sulfite treatment will affect the downstream methylation calling. In WGBS frameworks such as Accel-NGS MethylSeq, SPLAT and TruSeq, and sulfite sequencing of TrueMethyl and EMSeq, the widely used comparison softwares Bismark, BitMapperBS, BWA-METH and gemBS were evaluated.
By five library preparation methods using the same data of Seqtk, 1,000,000 bp paired terminal reads were subtracted from the sample data, and their running speeds were compared. The comparison results show that BitMapperBS has the highest alignment speed, with an average of about 550-650 reads per second. Bismark, BWA-METH and gemBS show the same comparison speed, Bismark is the most unstable.
 Mapping quality comparison across four alignment algorithms (Gong et al., 2022)
The QC after alignment quality control is very important in WGBS, and the intrinsic confounding variables of WGBS will make the methylation estimation biased towards over-estimation or under-estimation, which is mainly detected by M-bias diagram. Partial (incomplete) methylation may occur during sulfite treatment, and peaks values of C and T can be observed at this time, which usually leads to excessive detection. A ratio higher than 98.5% can ensure that there is no deviation. Spike sequence with unmethylated C can be added to methylated samples in all backgrounds (CpG, CHG and CHH), and then the number of unmethylated C and T can be counted, and the conversion rate of the added sequence can be calculated.
At the same time, the bias caused by underestimation will capture false negative methylation sites. For example, the end repair of fragmented double-stranded DNA mediated by enzyme will introduce unmethylated C at both ends of the fragment, which will lead to artificial underestimation of methylation level. This is reflected in the M-bias diagram that the average methylation level at both ends of the problem drops sharply, which should be discarded before methylation is extracted. Sulfite-mediated degradation is the main source of bias in WGBS, because the degradation is non-random and occurs on unmethylated cytosine, which is discarded from the library. This leads to many subsequent sequence deviations and overestimation of overall methylation.
After comparison with BitMapperBS, BWA-METH, Bismark and GemBS, it is recommended to use MethylDackel to extract methylation information. For example, MethylDackel is used to extract the methylation information of BitMapperBS after comparison. Methylation evaluation is carried out by comparing sequencing reads with the reference genome. If a site in the reference genome shows C, when C is noticed at the above site, 100% methylation is assigned, and when T is indicated, 0% methylation is assigned. Calculate the weighted average, and after calculating the number of C and T at this site, designate it as the final methylation level. For example, 10/10 Cs shows complete cytosine methylation, 6/10 Cs shows partial methylation (60%), and 0/10 Cs represents unmethylated cytosine.
Before extraction, the average methylation level of each site in the two chains was analyzed by M-bias to identify the basic technical deviation when extracting reads as pruning reference. Theoretically, reads should be constant, but the first and second reads in each pair are usually biased at the 5' and 3' ends. Man-made noise in reads will cause wrong methylation calling in the extraction process. MethylDackel gives pruning suggestions on the top and bottom lines, which can be used as parameters for subsequent extraction. MethylDackel generates a bedGraph file by comparing the BAM files, and records the information of methylated and unmethylated sites, which can be used for data filtering and further data analysis.
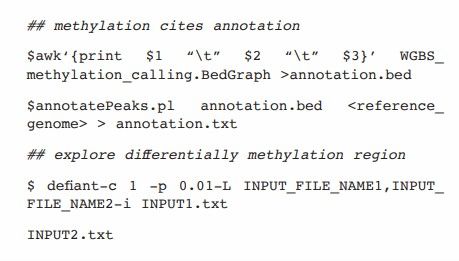 Annotation and Analysis of DMRs based on Bismark (Gong et al., 2022)
CpG methylation: The preparation method of CpG methylation library will significantly affect the average coverage of each CpG site. Unlike methylated chip data, there is no standardized normalization method for sequencing data. But data normalization is very important for downstream differential methylation detection. Downsampling achieves normalization by reducing the number of reads sequences and matching them with similar sequence data. Both BAM file generated by comparison and bedGraph file generated by methylation extraction can be downsampled. Downsampling in the comparison stage may require high time and memory, while downsampling in the extraction stage requires less time and memory, while ensuring the accuracy of similar methylated calling numbers, CpG sites detected, the distribution of reads numbers and average coverage. Therefore, before further data comparison, it is suggested to downsample bedGraph files, especially for the detection of differential methylation regions (DMRs).
DMRs: DMR detection is one of the core methylation analysis, which involves the analysis of genomic regions in multiple samples. The most common application is to find abnormal methylation regions between cancer and normal samples, which may be used as biomarkers or reveal the biology of diseases. Statistical analysis methods based on DMR vary from software to software, and the following are some main methods.
BSmooth: Local Likelihood Smoothing Approach is used to identify DMR in sample-specific methylation information. Welch's t-test(Student's t-test variant) was used to compare multiple samples. DMR is a CpG site with an observed P value higher than the predefined β value. However, predefined thresholds may lead to Class II errors (false negatives), thus affecting the results.
BiSeq: This problem is solved by incorporating the error detection rate and the β binomial distribution model, taking full account of biological duplication. Then the triangular kernel model is used to adjust the significant changes caused by the stratification process and calculate the statistical significance of the target area. P value is normalized, converted into Z score and average value for comparison.
MethylSig: Similar to BiSeq, β binomial distribution model is applied to consider the coverage and biological significance of reads.
Metilene: Binomial segmentation and multivariate Kolmogorov-Smirnov goodness-of-fit test (K-S test) are combined. This nonparametric method uses stepwise segmentation of genomic regions, which is steadily minimized to regions where the number of CpG is less than the predefined lower limit, or regions with no improvement in statistical significance. This method is more sensitive to the difference of cumulative sample distribution.
MethylKit: Fisher's exact test is used for single sample, and the statistical method based on logistical regression is used to calculate the differences between groups for multiple repeated samples.
Defiant: Defiant is an independent program that uses weighted Welch extensions to identify DMR. Fisher's exact test is used for two samples with only one repetition, and Welch's t-test is used for samples with multiple repetitions, and the variance of unbiased samples is weighted based on coverage.
Benjamini-Hochberg: Used to adjust the P value of multiple T tests in DMR identification. The data distribution is binomial in nature, because most methylation distributions are either completely methylated or completely unmethylated, indicating that the binomial distribution model is superior to other models.
Because the change of coverage of reads and the covariation of demographic parameters (such as gender, age and race) are strongly related to DMR detection, it is very important to normalize the data and adjust the covariates.
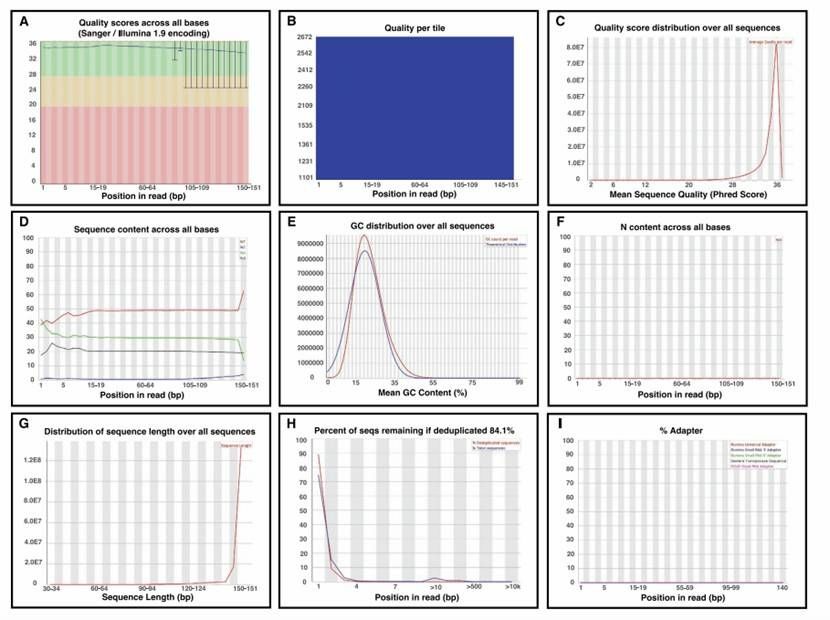 A research example of quality control report of FastQC (Gong et al., 2022)
WGBS can accurately detect the methylation level of all single cytosine bases (C bases) in the whole genome, which is the gold standard for DNA methylation research. WGBS can provide important technical support for the study of spatio-temporal specific modification of genomic DNA methylation, and can be widely used in the study of the mechanism of individual development, aging and diseases, and it is also the first choice for the study of methylation profiles of various species.
References
Terms & Conditions Privacy Policy Copyright © CD Genomics. All rights reserved.