RRBS Data Analysis: Workflow, Tools, and Biological Insights into DNA Methylation
Reduced Representation Bisulfite Sequencing (RRBS) is an important tool for studying DNA methylation. It is enriched for CpG-rich regions by restriction endonuclease cleavage, followed by bisulfite treatment, which converts unmethylated cytosine to uracil, while methylated cytosine remains unchanged. This technique can accurately locate methylation sites at single base resolution while reducing sequencing cost and data volume, making it possible to conduct large-scale sample research.
RRBS Data Analysis Process
RRBS data analysis aims to reveal DNA methylation patterns and functions. The original sequencing data were first evaluated for quality, and the low-quality and polluted sequences were removed. Subsequently, that proces sequence is aligned with a reference genome by a specific tool to determine its position. Based on the comparison results, the methylation status of CpG sites was counted and the level was calculated.
In order to explore the biological significance, different samples will be compared and different methylation regions and sites will be identified. Then, the function of related genes is annotated, the distribution in genomic elements is clarified, and the biological processes and signal pathways involved are revealed by enrichment analysis. The whole analysis process is closely linked, which provides key insights for understanding the role of methylation in biological processes. RRBS data analysis is used to explore DNA methylation patterns, and the main steps are as follows:
Data preprocessing: The raw RRBS data contained impurities such as sequencing errors and linker sequences. The first step is to remove the low quality base and linker, commonly used tools such as Trim Galore or Cutadapt. After that, the data quality was evaluated, and FastQC could generate a report showing such indicators as base quality distribution and GC content. If the quality is not good, parameters need to be adjusted or resequenced.
Sequence alignment: The processed data were compared to the reference genome to determine its position in the genome. Bismark is a common tool for RRBS data alignment. It is based on the Bowtie2 algorithm and can effectively handle the sequence alignment after bisulfite conversion to distinguish between methylated and unmethylated sites.
Methylation level calculation: After the comparison is completed, each CpG is countedlocus. The methylation level was calculated, i.e., the ratio of methylated reads to total reads. This value reflects the degree of methylation at the site and may be expressed at a single site, gene region, or whole genome Level analysis.
Differential methylation analysis: Differential methylation sites (DMS) or regions (DMR) were sought across multiple sets of samples, such as disease and health samples. Commonly used software such as methylKit considered biological duplication between samples and determined whether differences in methylation levels were significant through statistical testing. DMS And DMR can help reveal disease-related methylation changes.
Visualization analysis: Draw heat map, box map, volcano map and Circos map with r language ggplot2, circlize and other packages, visually display methylation data, and mine characteristics and laws.
Biological significance mining: The identified differentially methylated regions may be closely related to the regulation of gene expression. Hypermethylation of promoter regions often inhibits gene expression, while hypomethylation may promote expression. For example, in tumor research, hypermethylation of key tumor suppressor gene promoters may lead to gene silencing and promote tumor development
Integration with other data: RRBS data can be integrated with transcriptome data (such as RNA-seq). Comprehensive analysis of methylation and gene expression changes can provide a more comprehensive understanding of the epigenetic regulatory mechanism. In addition, the association between methylation patterns and disease diagnosis and prognosis can be explored based on clinical data, so as to provide a basis for accurate medicine.
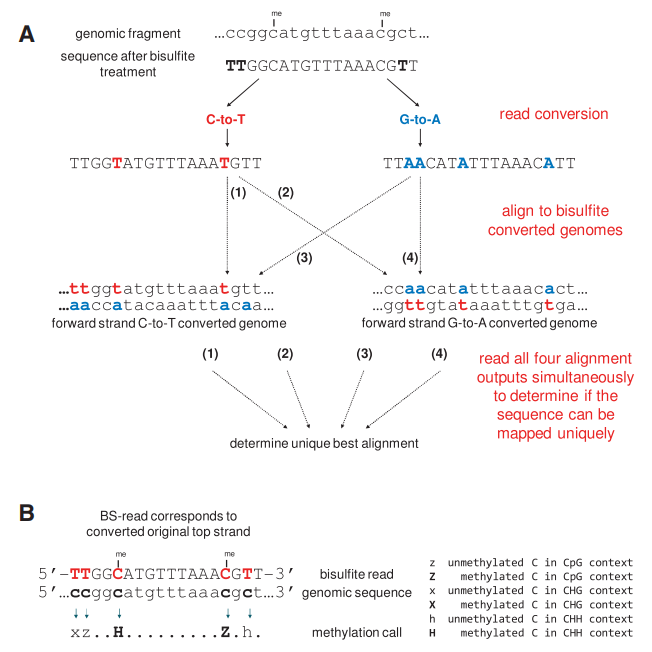 Bismark's approach to bisulfite mapping and methylation calling (Felix et al., 2011)
Service you may intersted in
If you want to learn more about the RRBS, please refer to:
Software for RRBS Data Analysis
DNA methylation plays a key role in gene expression regulation, development, and disease occurrence. With the development of sequencing technology and the emergence of a large number of methylation data, various types of methylation analysis software emerged as the times require, helping researchers to tap the biological significance behind the data.
Methylation sequencing data processing software
- Bismark was designed for bisulfite sequencing data. It is based on the Bowtie short sequence alignment algorithm, and can effectively align the bisulfite-treated sequence to the reference genome. Because bisulfite treatment alters DNA sequence characteristics, Bismark is able to accurately distinguish methylated from unmethylated cytosines, thereby localizing methylation sites, which is widely used in data processing for RRBS and WGBS.
- BSMAP is also used for hydrosulfite Sequencing data comparison. It adopts the seed expansion strategy, has a good tolerance for sequencing errors and genomic polymorphism, and is suitable for complex genomic data. The software could not only compare the data efficiently, but also calculate the methylation level of each site and output results in a variety of formats for subsequent analysis.
Software for methylation level analysis
- MethylKit is a methylation analysis tool developed in the R language that supports methylation data generated by a variety of sequencing technologies. It can handle biological duplication between samples and identify differentially methylated sites (DMS) and regions (DMR) between different sample groups through strict statistical tests. In addition, the methylKit enables visualization of methylation levels and provides an intuitive view of data distribution.
- Differential Methodology Sequencing (DSS) is based on the beta-binomial model and is dedicated to analyzing differentially methylated regions. The software performs well in low coverage data and effectively controls the false-positive rate. It scans the genome using a sliding window strategy to detect the differences in methylation levels among different sample groups, which is widely used in the methylation research of diseases such as cancer.
Methylation data visualization software
- Although not specifically dedicated to methylation, Integrative Genomics Viewer (IGV) is powerful and capable of integrating multiple genomic data, including methylation data. Users can visually view methylation sites, gene structures and other annotation information in the genome browser, conduct multi-data joint analysis, and understand the relationship between methylation and gene regulation in depth.
- MeVis is designed for the visualization of methylation data with a friendly interface. It can display the methylation level in a variety of graphics, such as heat map, boxmap, etc., which is convenient for users to quickly identify the methylation pattern differences between samples, conduct sample clustering analysis, and display the global characteristics of methylation data.
Methylation function annotation software
- ChIPseeker was used primarily for annotation of the ChIP-seq data and also for methylation data. It can map differentially methylated regions to genomic functional elements, such as promoters and enhancers, and conduct gene ontology (GO) and Kyoto Encyclopedia of Genes and Genome (KEGG) pathway enrichment analysis to reveal methylation-related biological functions and signaling pathways.
- ROSE is used to identify the enhancer region. Combined with the methylation data, we can study the effect of enhancer methylation on the regulation of gene expression. It provides important information for understanding epigenetic regulatory networks by analyzing chromatin status and methylation patterns, identifying potential enhancers, and assessing their interaction with target genes.
Using MethylKit to Analyse RRBS Data
DNA methylation is crucial for gene regulation. There are many measurement techniques, but no comprehensive and easy-to-use analysis tools. MethylKit has been developed to process Qualcomm methylation sequencing data for multi-faceted analysis.
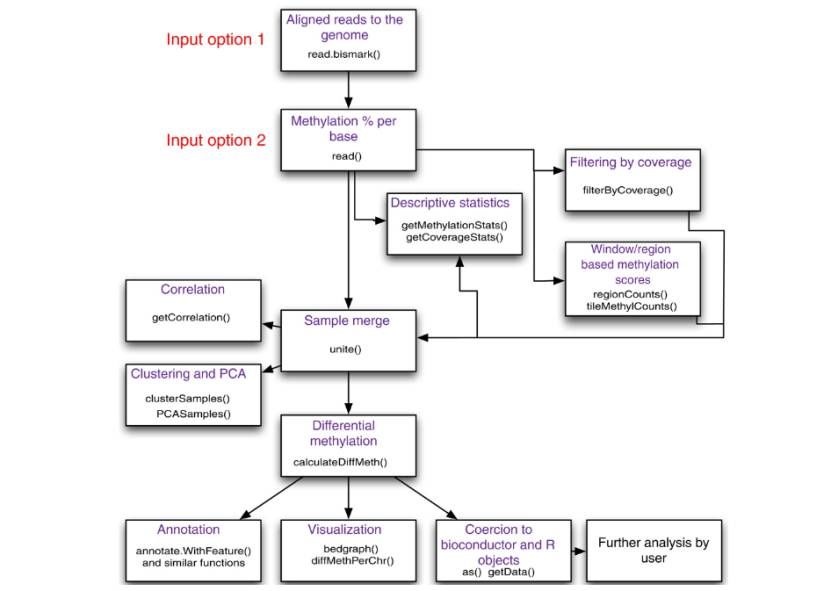 Flowchart of possible operations by methylKit (Altuna et al., 2012)
MethylKit features
- Data integration and region analysis: The data can be read from text or SAM file, supporting multi-experiment sample analysis. The methylation information in different contexts can be provided according to user requirements, and the methylation information in predefined regions or windows can be summarized.
- Analysis of characteristics of fully methylated groups included descriptive statistics (such as showing the percentage of methylation and read-length coverage distribution), sample correlation measurement and visualization (calculation of correlation coefficient, drawing of scatter diagram and clustering analysis) and principal component analysis to help understand the sample characteristics and relationship.
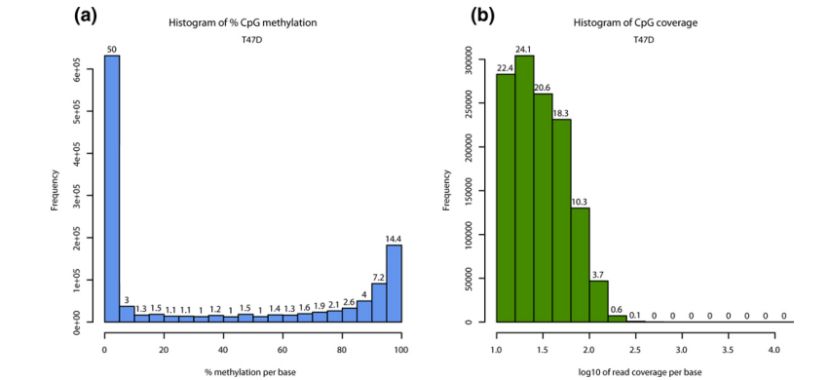 Descriptive statistics per sample (Altuna et al., 2012)
- Calculation and visualization of differential methylation: Differential methylation was detected using logistic regression and Fisher's exact test, and P value was corrected using SLIM or Benjamini-Hochberg method. Differential methylation events could be extracted and visualized according to parameters, such as drawing bar graphs and generating bedgraph tracks.
- Annotation function: Differentially methylated events can be annotated with associated gene models, CpG islands, and user-defined regions to clarify their location in the genome and potential biological effects.
- 5-hydroxymethylcytosine data analysis: Relevant data can be processed to adjust the level of 5mC through the adjust methylC function.
- Compatibility with other tools: rely on the Bioconductor package to integrate with other R packages for user-customized analysis.
 Visualizing differential methylation events (Altuna et al., 2012)
Application examples
Taking breast cancer cell line data as an example, the ability of methylKit to analyze the methylation differences of cell lines with different estrogen receptor expression states was demonstrated, such as identifying differentially methylated regions, clustering samples, and revealing their correlation with gene expression.
The methylKit has provided researchers with an effective tool for processing and analyzing genome-wide methylation data, with important practical value.
DSS to Detect DMS Based on RRBS Data
DNA methylation is a key epigenetic modification that has been implicated in a variety of biological processes and diseases. The RRBS technique can be used to measure DNA methylation, but the key to analyzing its data is to identify DML or DMR. DSS is a common analysis software package. It uses the beta binomial distribution model to model the sequence count of BS-seq data, and performs hypothesis testing through strict statistical methods to achieve differential methylation analysis, and can process data from different experimental designs.
Material and data preparation
- Software installation: DSS is a Bioconductor package. You need to install first, and then install its related dependent packages from Bioconductor official website and load them in r environment.
- Data pretreatment: The original sequencing data was in FASTQ format, and quality control and sequence trimming were required. The reference genome was aligned using a specific alignment tool (such as Bismark) and the methylation signal of each CpG site was extracted to conform to the DSS input format (including chromosome name, coordinates, total read length and methylation read length).
- Example data: A public data set (GSE52140) from GEO containing RRBS data from two lung cancer cell lines (A549 and HTB56) under both normal and metastatic conditions, with two biological replicates per combination for a total of eight samples, was used to demonstrate the different analytical capabilities of DSS.
DSS analysis process
- Data reading: RRBS data of each sample were processed into a format meeting the requirements of DSS, and chromosome number, coordinates, total read length and methylation read length information corresponding to each CpG locus were stored as data frame objects.
- Routine two-group comparison analysis: RRBS objects were created and multiple duplicate samples of two groups were included. Statistical testing was performed using a DMLtest function, optionally smoothed to estimate mean methylation level and dispersion, and a Wald test was performed. DML was identified by the callDML function based on a set P-value threshold, which may be combined with a methylation difference threshold. The callDMR function is used to combine the nearby sites into DMR, and relevant parameters can be set. Finally, the DMR was visualized using the showOneDMR function, displaying methylation levels and sequencing coverage depth information.
- Duplicate-free comparative analysis of the two groups: Only one sample was included in each group when the RRBS objects were created, smoothing was required to be set in the DMLtest function to estimate the intra-group variance using the spatial correlation of methylation levels, and subsequent steps for DML, DMR, and visualization were similar to those of the conventional two groups.
- General experimental design analysis: RRBS objects containing all samples were created, and experimental design data frames corresponding to the samples were constructed. The linear model was fitted with DMLfit.multiFactor function, and relevant factors and interactions were included. The DMLtest.multiFactor function is used to test model parameters, and different methods can be selected to specify test parameters. When DMR was identified using the callDMR function, the methylation difference threshold was not applicable and only statistical significance was used. The DMR can also be visualized using the showOneDMR function, which saves the results as a PDF file.
- Downstream analysis: After obtaining DML or DMR, it can be used for overlapping analysis with gene functional elements (such as TSS, TES, gene, intron, exon), or research on methylation spectrum changes of specific genes or regions, or whole genome analysis. For example, to obtain a list of overlapping genes and conduct Gene Ontology (GO) analysis or Gene Set Enrichment Analysis (GSEA), tools such as TopGO or GSEABase can be used with Bioconductor software.
- Discussion and limitations: DSS provides a comprehensive, flexible and efficient function for the differential methylation analysis of RRBS. However, there are still some unsuitable scenarios, such as paired design experiments, complex multi-factor experiments without considering spatial correlation, clustering experimental design and longitudinal data types, which will be the research directions in the future.
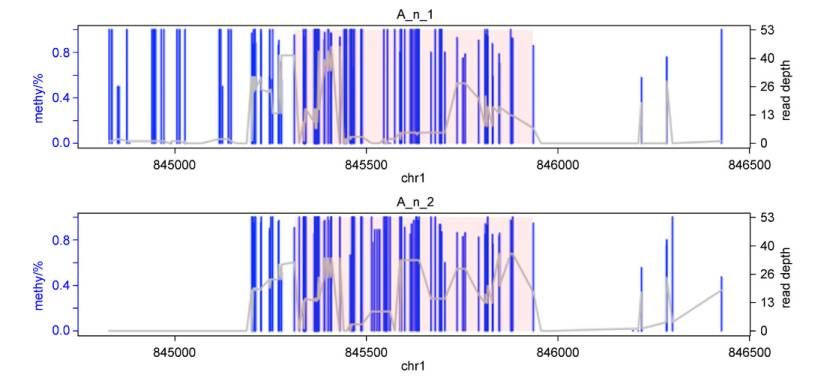 Visualization of one detected DMR (Feng et al., 2021)
mHapBrowser for Visualization RRBS Data in Research
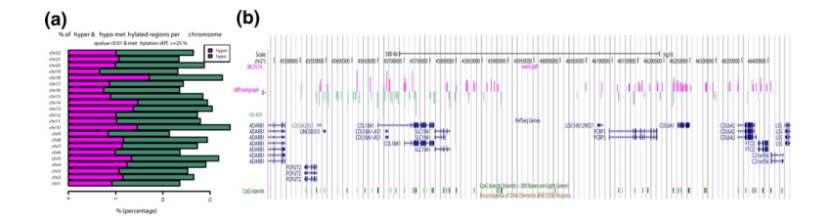
In one paper titled "mHapBrowser: A comprehensive database for visualization and analysis of DNA methylation haplotype", mHapBrowser database is introduced, which can be used for the visualization and analysis of DNA methylation haplotypes (mHaps), providing important resources and tools for relevant research.
Background and objective
DNA methylation is the key epigenetic modification. However, the existing methylation databases mostly focus on the average methylation level and ignore the phase methylation pattern. This paper aims to build mHapBrowser database and analyze mHaps data in a consolidated way.
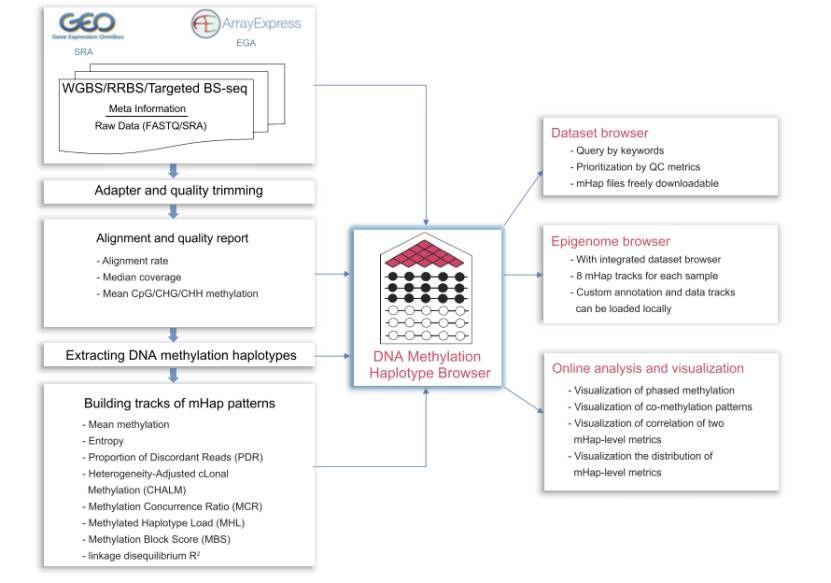 Overview of mHapBrowser (Hong et al., 2024)
Materials and methods
- Data source: DNA methylation sequencing data were collected from public databases such as NCBI Gene Expression Omnibus (GEO), Sequence Read Archive (SRA) and ArrayExpress, and sample annotation was performed.
- Data processing flow: The original data were subjected to such operations as format conversion, linker removal, comparison of reference genome, and labeling of repeat sequences. mHapTools was used to extract mHaps and store them in a specific format. Finally, mHapSuite was used to calculate nine DNA methylation indicators, including mean methylation (MM) and inconsistent read segment ratio (PDR).
Database implementation and function
Architecture and technology: based on Node.js development, front-end JavaScript and TypeScript combined with React and Material-UI construction, back-end hAPI framework, data storage with MySQL and MongoDB, through the back-end api access data and execute analysis module.
Kernel module
- Dataset browser: displays sample metadata and quality control indicators, supports keyword queries, and facilitates users to filter high-quality samples.
- Epigenome browser: integrated WashU Epigenome Browser, which can visually select the trace of 9 methylation indexes of samples, and can also upload custom data and annotation track.
- Online analysis and visualization module: It provided a variety of tools such as Tanghulu diagram, scatter diagram, and boxplot diagram for analyzing and displaying DNA methylation pattern and comparison between different samples.
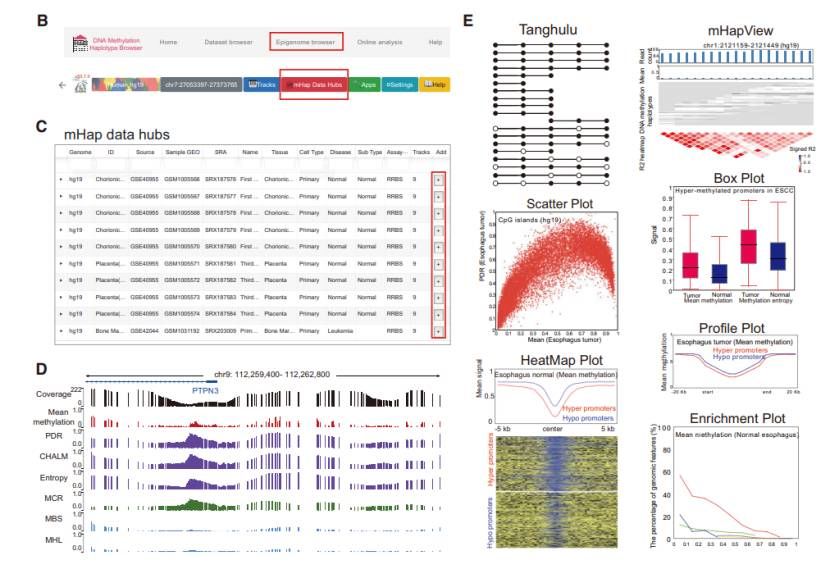 Core modules in mHapBrowser (Hong et al., 2024)
Case study
- MHap pattern associated with gene expression: Analysis of normal esophageal tissue data revealed a negative association of gene expression with mean methylation at the promoter region, PDR, and MCR, and found that genes with different levels of promoter mHap inconsistency showed different expression distributions, inconsistencies, their expression distributions were different, indicating that the mHap pattern was related to gene expression.
- MHap pattern was associated with differential gene expression: Analysis of NSCLC and SCLC samples from CCLE data showed that after controlling the mean methylation change, the promoter PDR of the differentially expressed gene was significantly changed, and the gene expression change was related to six mHap indicators. For example, the expression difference of CADPS gene in two cancers could be explained by the change in mHap pattern in the promoter region.
- DNA methylation profiling in cancer detection: MHL markers were evaluated using mHapBrowser and were found to differentiate tumors from normal samples across multiple tumor types, and the MHL model outperformed the mean methylation model in cancer detection based on cell free DNA.
- Discussion and future development: mHapBrowser provides a centralized resource for DNA mHaps research, but still needs to expand datasets, update mHapSuite capabilities, and integrate multi-omics data to facilitate applications such as basic research and early detection of cancer.
In conclusion, RRBS data analysis is a complex and rigorous process, from raw data to biological discovery, every step is crucial. Through in-depth analysis of RRBS data, we are gradually unraveling the mystery of DNA methylation in health and disease, opening up new pathways for life science research and clinical application.
There are a variety of methylation analysis software, each has its own advantages. Scientific research personnel should be reasonably selected according to the experimental purpose, data types and analysis requirements. With the development of technology, the functions of software will be more powerful and integrated, which will help us to deeply explore the mysteries of methylation in life processes and diseases.
References
- Felix Krueger and Simon R. Andrews. "Bismark: a flexible aligner and methylation caller for Bisulfite-Seq applications." Bioinformatics (2011): 1571-1572. doi:10.1093/bioinformatics/btr167
- Altuna Akalin, Matthias Kormaksson, Sheng Li and Christopher E Mason. "methylKit: a comprehensive R package for the analysis of genome-wide DNA methylation profiles." Genome Biology (2012) 13:R87. http://genomebiology.com/2012/13/10/R87
- Feng Hao and Hao Wu. "Differential methylation analysis for bisulfite sequencing using DSS." Quant Biol (2019): 327–334. doi:10.1007/s40484-019-0183-8
- Hong Yuyang, Liu Leiqin, Feng Yan and Zhang Zhiqiang. "mHapBrow ser: a comprehensive database fo r visualization and analysis of DNA methylation haplotypes." Nucleic Acids Research (2024): D929–D937. https://doi.org/10.1093/nar/gkad881
! For research purposes only, not intended for clinical
diagnosis, treatment, or individual health assessments.