
 Sample Submission Guidelines
A series of studies have corroborated that T-cell Receptor (TCR) repertoire serves as a biomarker for monitoring immune responses. CD Genomics has pioneered the development of an advanced high-throughput sequencing method, TCR-Seq, to characterize this TCR library.
Introduction of TCR-Seq
The T cell receptor, an intrinsic surface protein of T cells, plays the pivotal role of recognising antigen peptides complexed within the Major Histocompatibility Complex (MHC). The binding of TCR to such peptide-MHC complexes activates the T lymphocytes through signal transduction, thereby propelling subsequent immune responses. Four rudimentary TCR genes exist within the human genome, namely:
Two light chain TCR genes, namely the TRA gene encoding TCRα and the TRG gene encoding TCRγ.
Two heavy chain TCR genes, identified as the TRB gene which encodes TCRβ, and the TRD gene encoding TCRδ.
Antigen recognition mediated by T cells is dependent on the interactions between T cell receptors (TCR) and Major Histocompatibility Complex (MHC) molecules. The immense diversity exhibited by TCRs, attributable to the rearrangement of Variable (V), Diversity (D), and Joining (J) genes, plays a pivotal role in the adaptative immune system. Exploring this mechanism, sequencing and analysis of the TCR repertoire might enhance our understanding of adaptive immune responses and potentially unlock the discovery of new infectious agents. This holds invaluable potential for aiding in the development of antibodies or vaccines, thereby contributing to clinical diagnosis, treatment, and prevention measures.
The T-cell receptor (TCR) constitutes a highly diverse heterodimer, comprised of either α and β chains (αβ TCR), expressed by the majority of T cells, or γ and δ chains (γδ TCR), expressed by a subset of T cells found in peripheral blood (1-5%) and mucosal sites. Each TCR chain is characterized by three hypervariable loops known as complementary determining regions (CDR1-3). CDR3, encoded by the junctional region between the V and J or D and J genes, exhibits significant variability. Moreover, CDR3 represents the region of the TCR directly engaged in peptide antigen recognition. Consequently, it plays a pivotal role in the interaction between TCRs and peptide-MHC complexes, thus rendering it a primary focus in TCR repertoire studies.
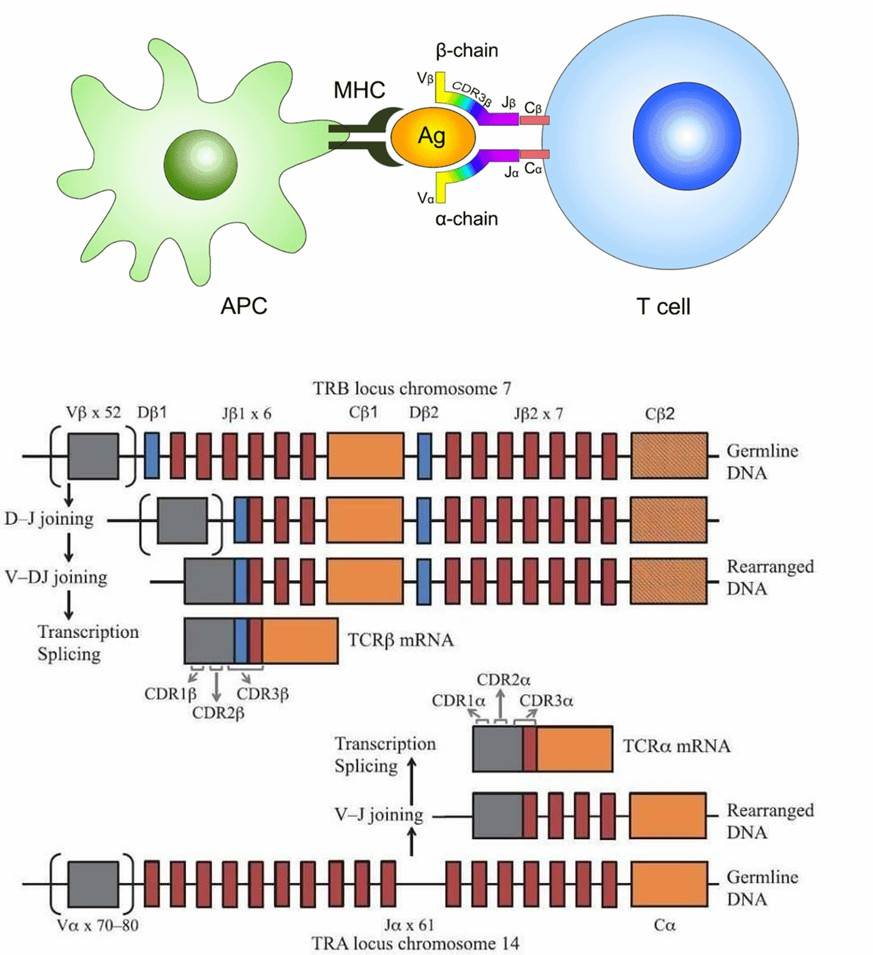 Figure 1. The function and composition of T-cell Receptor (Rosati et al., 2017).
Advantages of TCR-Seq
- The methodology is applicable in a multitude of species, inclusive of humans and mice.
- It accommodates various sample types, encompassing RNA, DNA, T-cells, blood, and tissue specimens.
- The sequencing set-up is highly adaptable, employing configurations such as Illumina MiSeq PE300 and HiSeq PE150/250.
- A complete T-Cell Receptor (TCR) analysis is carried out, harnessing the principles of the 5'RACE technology. This enables the acquisition of full TCR sequences, facilitating comprehensive studies on the impact of Complementarity Determining Regions 1 and 2 (CDR1/2) on Major Histocompatibility Complex (MHC) affinity.
- Remarkably, this methodology demonstrates lower PCR bias. Similarly utilizing the 5'RACE technique principles, it shows lesser bias preference in comparison to multiplex PCR (mPCR). This underscores the strength of the approach in ensuring the delivery of reliable and accurate sequencing results.
Application of TCR-Seq
- Immunology Research
- Research on Infectious Diseases
- Vaccine Development:
- Oncological Immunotherapy
- Research on Infectious Diseases
- Immune Monitoring
TCR-Seq Workflow
Our TCR-Seq service combines popular next-generation sequencing (NGS) and bioinformatics technologies to create an unprecedented high-resolution image of the TCR repertoire, providing immense potential in uncovering the dynamic changes in clonal populations during antigen stimulation. Our TCR-Seq strategy entails the capture of CDR3 utilizing multiplex PCR, 5' RACE, or targeted enrichment methods which then undergo in-depth sequencing and data analysis. The workflow of this strategy is illustrated as in the following diagram.
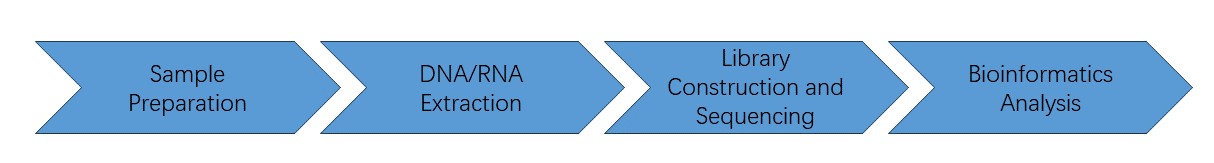
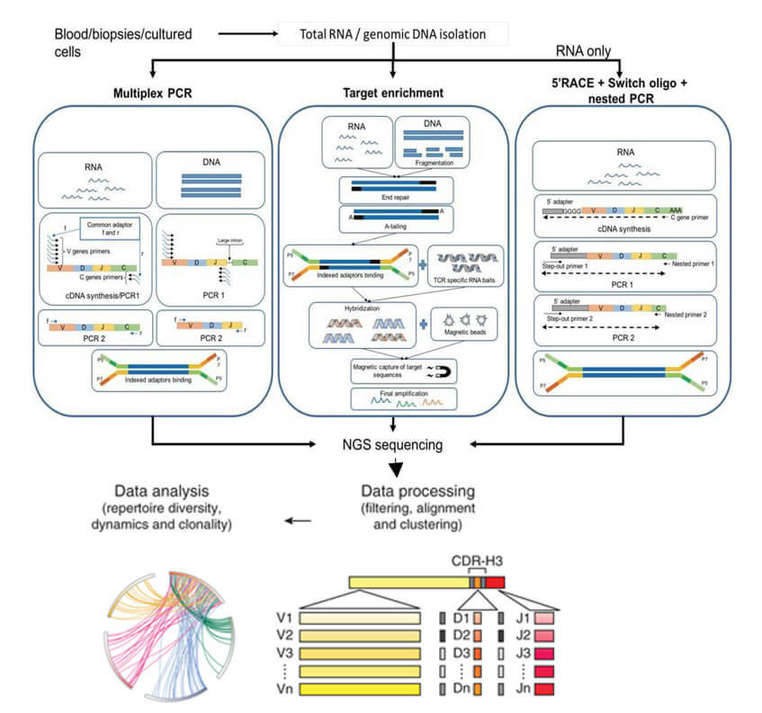 Figure 2. Schematics of steps for TCR-seq.
Service Specification
Sample requirements and preparation
|
|
 |
Sequencing
|
 |
Bioinformatics Analysis
|
Deliverables
Project reports and FASTQ files
contain sample quality, sequencing parameters, bioinformatics analysis, and results
With a team of seasoned experts and years of experience in this field, CD Genomics assures the delivery of superior data quality and comprehensive bioinformatics analyses. If you are interested in discovering what CD Genomics can offer you through TCR sequencing, please do not hesitate to get in touch with us. We are always eager and available to assist you!
References:
- Rosati E, et al. Overview of methodologies for T-cell receptor repertoire analysis. BMC Biotechnology. 2017, 17(61).
- Cui J. H, et al. TCR repertoire as a novel indicator for immune monitoring and prognosis assessment of patients with cervical cancer. Front. Immunol. 2018, 9(2729).
- Frank M L, Lu K, Erdogan C, et al. T-cell receptor repertoire sequencing in the era of cancer immunotherapy. Clinical Cancer Research, 2023, 29(6): 994-1008.
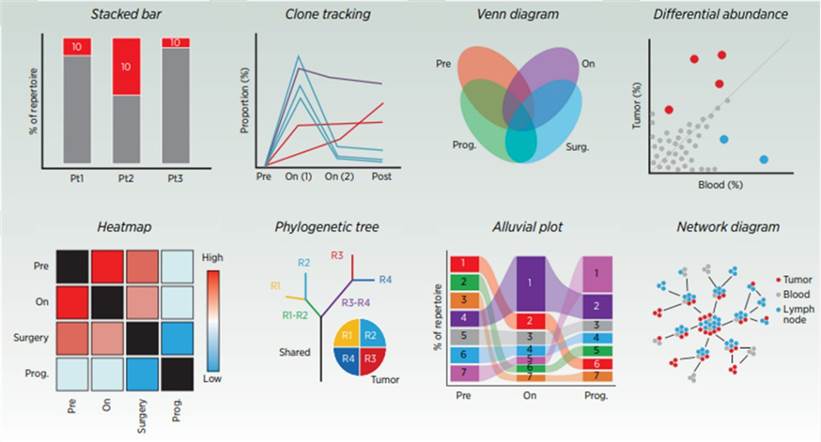 Common representations of TCR-related data. (Frank et al., 2023)
What is TCR sequencing used for?
TCR sequencing represents a critical technical approach for investigating the diversity and clonal composition of T cell receptors (TCRs), and their functions during immune responses and disease processes. It offers an effective tool for monitoring the status and function of T cells within transplant rejection, infections, and immunosuppressive therapy. By analysing the TCR repertoires in a patient's peripheral blood or tissues, our comprehension of the immune function recovery and disease progression can be greatly enhanced.
TCR sequencing facilitates a deeper understanding of T cell maturation, differentiation, and function. It allows for revealing the genetic and epigenetic regulatory mechanisms of TCRs, along with their interactions with other immune cells and signalling pathways, through the investigation of the TCR diversity and clonal infrastructure.
In tumour immunotherapy, analysis of the TCR composition of tumour infiltrating lymphocytes (TILs) may assist in evaluating a patient's potential response to the immunotherapy. Additionally, in autoimmune diseases, analysis of a patient's T cell TCR composition could serve to uncover abnormal immune responses and clonal proliferation.
Through exploring T cell TCR composition, it is possible to identify likely biomarkers of therapeutic response, and to further evaluate the pharmacodynamic impact of treatments on the immune system.
How to select materials for TCR sequencing research?
The methodology for TCR-Seq can be delineated into two salient categories based on the primal material used: DNA and RNA. DNA-based methods, stand out thanks to their ability to quantify individual TCR clones with precision, given that each cell holds a unique template. However, this uniqueness could potentially contribute to an escalation in the overall cost of TCR-Seq. On the other hand, RNA-based methods offer a high degree of sensitivity, enabling a quantitative estimation of both TCR abundance and gene expression. Additionally, RNA-based methods can easily combine with unique molecular identifiers (UMIs) to reduce PCR bias and enhance the accuracy of identification for rare variants.
What are the advantages and disadvantages of two TCR library construction strategies?
The primary methods for T cell receptor (TCR) sequencing are multiplex PCR (mPCR) and 5' Rapid Amplification of cDNA Ends (5'RACE). mPCR, supporting both DNA and RNA initiation, usually comprises two rounds of PCR. The first round aims to amplify the receptor gene locus and incorporates known sequences for the second round PCR primer sites, with sequencing adaptors and indices being subsequently incorporated. However, the high diversity at the primer sites of overlap sites in the first round PCR necessitates a large number of degenerated primers, thus predisposing to PCR bias.
The 5'RACE technique, on the other hand, uses RNA as a template and only requires one pair of primers per PCR round. This significantly reduces PCR bias and ensures that the results accurately reflect the authentic condition of the samples.
What is the difference between TCR and BCR?
T-cell receptors (TCR) and B-cell receptors (BCR) represent distinct classes of immune receptors that exhibit significant differences in both function and structure. As their names suggest, these receptors are present on the surfaces of different cell types. The TCR, a relatively simpler construct, consists only of two chains, whereas the BCR comprises four chains. A cardinal function of TCR consists of recognizing antigen peptides specifically presented on the cell surface, typically presented by Major Histocompatibility Complex (MHC) molecules. Contrarily, BCR's primary role is the identification of antigen molecules that are free-floating within a solution, encompassing a range of molecular entities including proteins, polysaccharides, among others.
The immune response mediated by TCRs chiefly pertains to cell-mediated immunity, encompassing recognition and clearance of infectious microorganisms and tumor cells. On the other hand, BCR-mediated immune responses primarily involve humoral immunity, extending to the generation of antibodies and neutralization and clearance of antigens. TCRs, mainly expressed on T cells in lymphoid tissue, participate in modulating cellular immune responses. Conversely, the BCRs, predominantly expressed on B cells, partake in humoral immune responses.
T-cell receptor sequencing reveals hepatocellular carcinoma immune characteristics according to Barcelona Clinic liver cancer stages within liver tissue and peripheral blood
Journal: Cancer Science
Impact factor: 5.7
Published: November 14, 2023
Backgrounds
T lymphocytes, recognizing the Major Histocompatibility Complex (MHC) molecules through the T cell receptor (TCR) found on their cell surface, are integral to the human adaptive immune response. Hepatocellular carcinoma (HCC) ranks fourth globally in terms of mortality related to cancer. The immune microenvironment of HCC encompasses different functional subgroups of T lymphocytes. Currently, the clonal features and diversity of TCRs at different stages of HCC remain largely unexplored. The latest research findings, published in Cancer Science by the team led by Professor Wang Yijin at the Southern University of Science and Technology, strive to examine the immunological features of T cells originating from different tissues at various stages of HCC. This research will contribute to elucidating the progression mechanisms of HCC and pave the way for developing cell-based therapeutic methods targeting specific neoantigens.
Methods
- Illumina HiSeq system, high-throughput sequencing
- Shannon Index, Diversity 75 (D75), Singleton Index, Gini-Simpson Index
-
SPSS version 22.0, GraphPad Prism, Dunnett's multiple comparisons test, Kaplan–Meier curves, Mann–Whitney test
Results
1. Interpatient heterogeneity analysis of CDR3 sequences
This study examined shared CDR3 sequences across all sample types from 25 HCC patients. The percentage of shared CDR3 sequences between adjacent tissues and tumor tissues was 4.3%, and between PBMCs and tumor tissues was 1.5%. No significant differences were observed in shared CDR3 sequences between adjacent tissues and tumor tissues, or between PBMCs and tumor tissues across all three stages. While shared TCR clonotypes were limited in adjacent tissues and PBMCs, there were more shared TCR clonotypes in BCLC_C stage tumor tissues compared to BCLC_A and BCLC_B stages. TCR similarity was assessed using the Jaccard Index, revealing higher similarity in tumors compared to adjacent tissues but similar to PBMCs. Patients in BCLC_C stage exhibited increased TCR similarity across all sample types. The Morisita Overlap Index was utilized to quantitatively evaluate overlapping clonotypes, indicating a higher degree of overlap in BCLC_C stage patients compared to BCLC_A and BCLC_B stages, although not statistically significant.
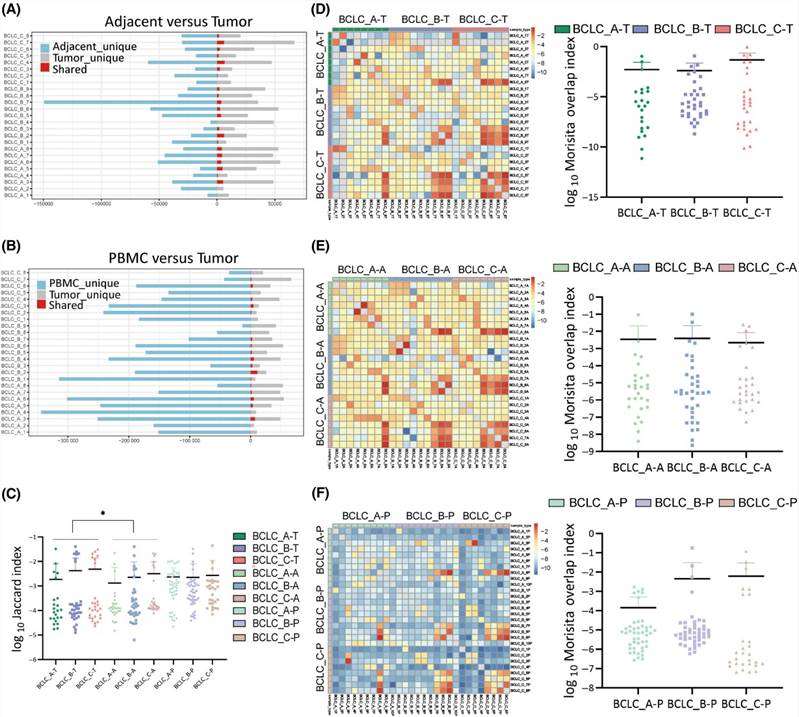 Figure 1. Interpatient heterogeneity analysis of CDR3 sequences
2. Diversity and clonality of CDR3 sequences
The study investigated V and J gene segments expression, focusing on CDR3 sequences to assess TCR diversity and clonality in different stages of HCC. It identified highly expressed gene segments and analyzed the frequency of top 100 CDR3 sequences in tumor tissues and PBMC samples across stages, indicating higher TCR clonality in advanced HCC. Additionally, detailed analyses of CDR3 frequency distributions and clone fractions revealed decreased diversity and increased clonality in advanced HCC stages, supported by various quantitative measures. Overall, the findings suggest a gradual decline in T cell diversity with HCC progression in PBMCs.
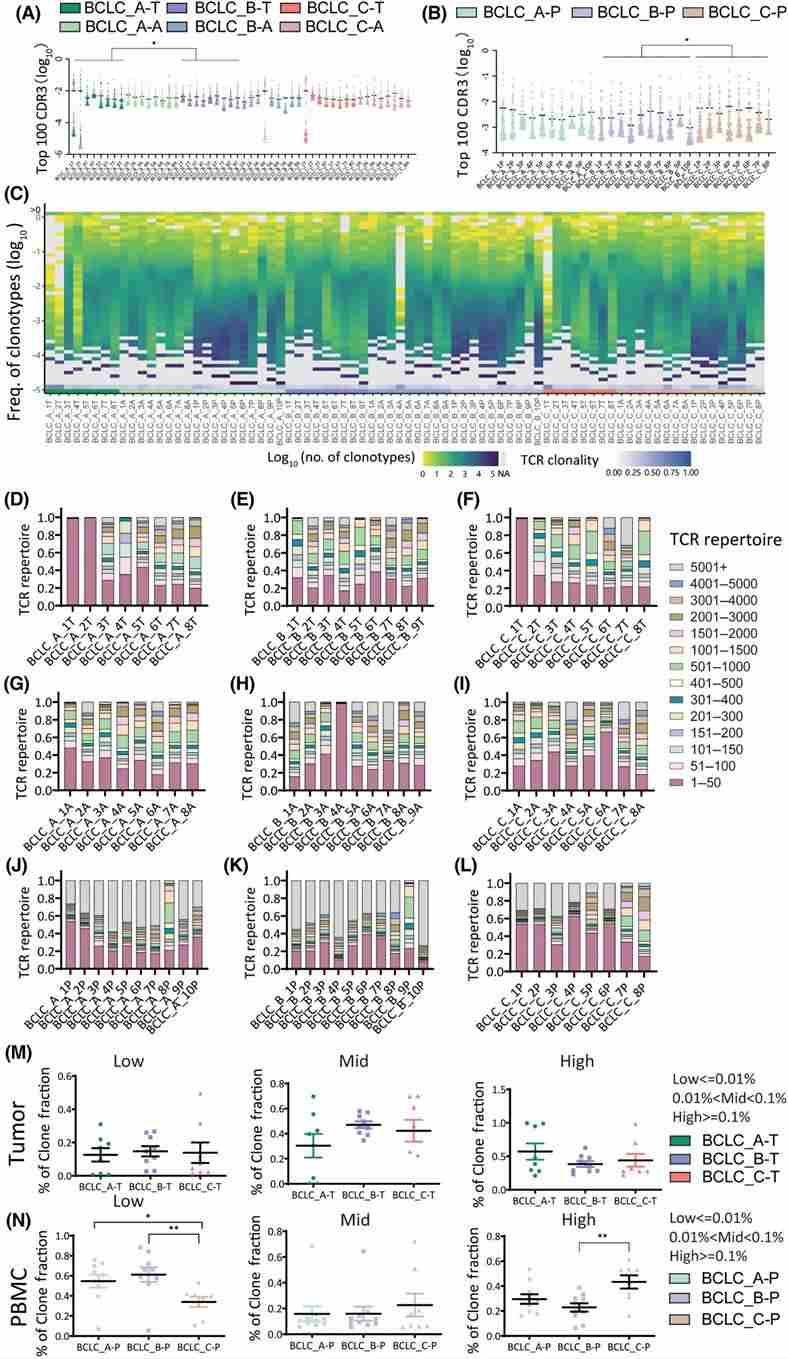 Figure 2. Quantification analysis of CDR3 sequences in BCLC_A–C stages in tumors, adjacent tissues, and peripheral blood mononuclear cells (PBMCs)
3. CDR3 length and amino acid composition
Aberrations in the length and composition of the complementarity-determining region 3 (CDR3) can significantly impact a patient's adaptive immune response. Across all three stages - within the tumor, adjacent tissues, and peripheral blood mononuclear cells (PBMCs) - no significant difference in CDR3 length distribution was observed. Analysis revealed a lower enrichment of hydrophobic amino acids at positions 6 and 7 in patients with late-stage hepatocellular carcinoma (HCC), indicating impairment in the development and function of autoreactive T cells.
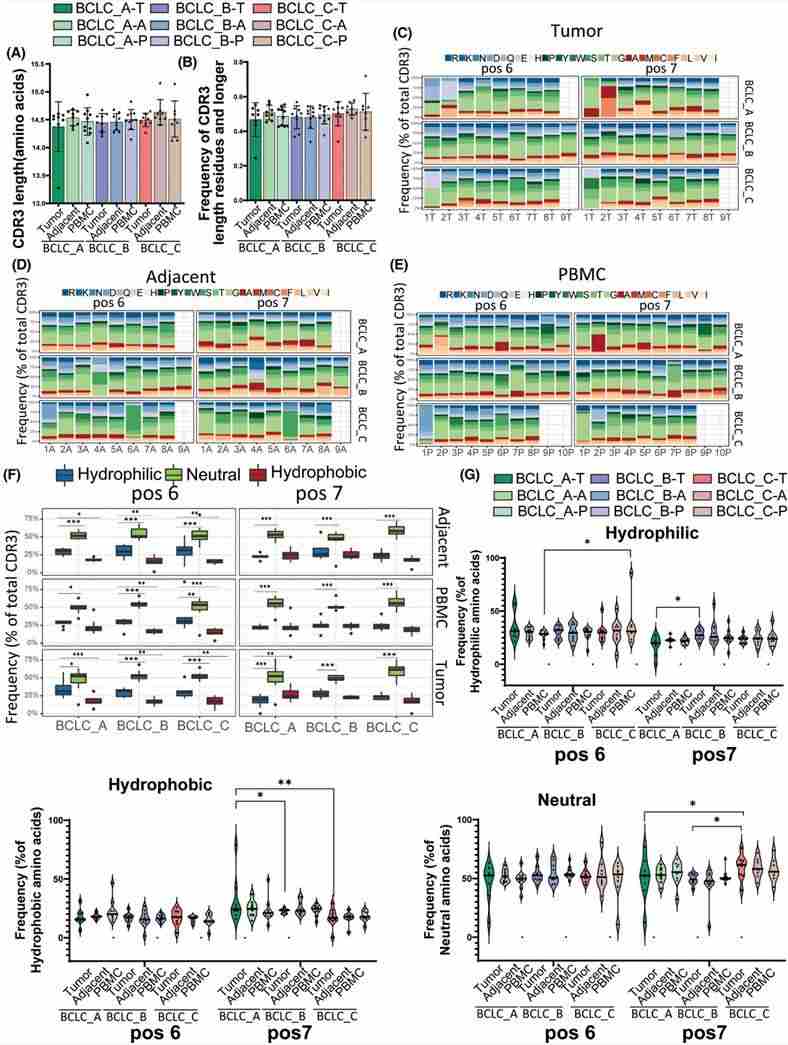 Figure 3. CDR3 length analysis and amino acid composition.
4. Comparison of TCR repertoires between relapsed and non-relapsed patients
Using the Kaplan-Meier method, overall survival (OS) was calculated for BCLC_B and BCLC_C patient groups. The median OS was found to be 13.0 months (95% CI 10.1–15.9) for BCLC_B stage and 5.5 months (95% CI 3.2–6.8) for BCLC_C stage. Hazard ratio analysis revealed distinct prognostic disparities between different BCLC stages, with lower risk ratios evident for BCLC_C stage patients compared to BCLC_A and BCLC_B stage patients. Further analysis identified a correlation between a higher frequency of top 100 CDR3 and improved prognosis. Among patients with recurrence, those with the tumor and PBMC showed greater TCR diversity compared to non-recurring patients, whereas the frequency of hydrophobic amino acids was lower in recurring patients.
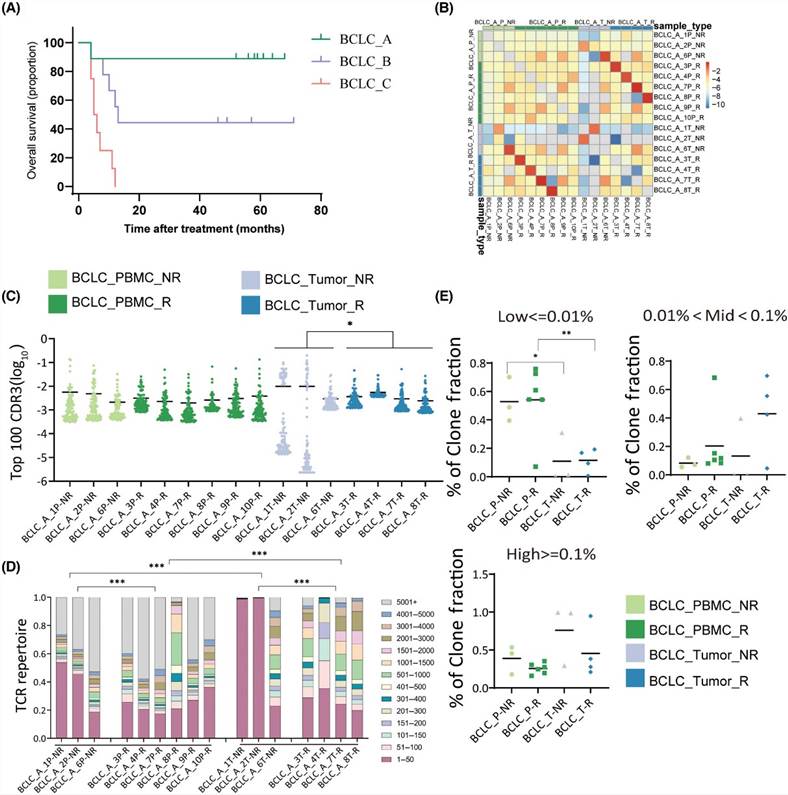 Figure 4 (A) Difference analysis of TCR repertoires in relapsed and non-relapsed patients. (B) Overlap of CDR3 sequence between relapsed and non-relapsed patients. (C) TCR sequencing data showed top 100 the most prevalent CDR3 sequences. (D) Visualization of clone proportions occupied by the CDR3 sequences.
5. Analysis of TCR repertoire in one patient with relapsed tumor
TCR sequencing conducted on a recurrent patient's original tumor (T1), newly developed tumors (T2 and T3), and PBMCs (P1 and P2), discerned a high degree of TCR clone overlap in PBMCs, potentially attributable to an abundance of the CATSDPSTGTTGELFF CDR3 sequence. Clonal indices indicated a higher clonality in P1 than in P2 and in T1 more so than T2 and T3, despite statistically insignificant differences. Recombination of TRBV and TRBJ genes displayed elevated similarity among T1, T2, and T3, suggesting potential substantial variations in TCR repertoires between primary and recurring tumors.
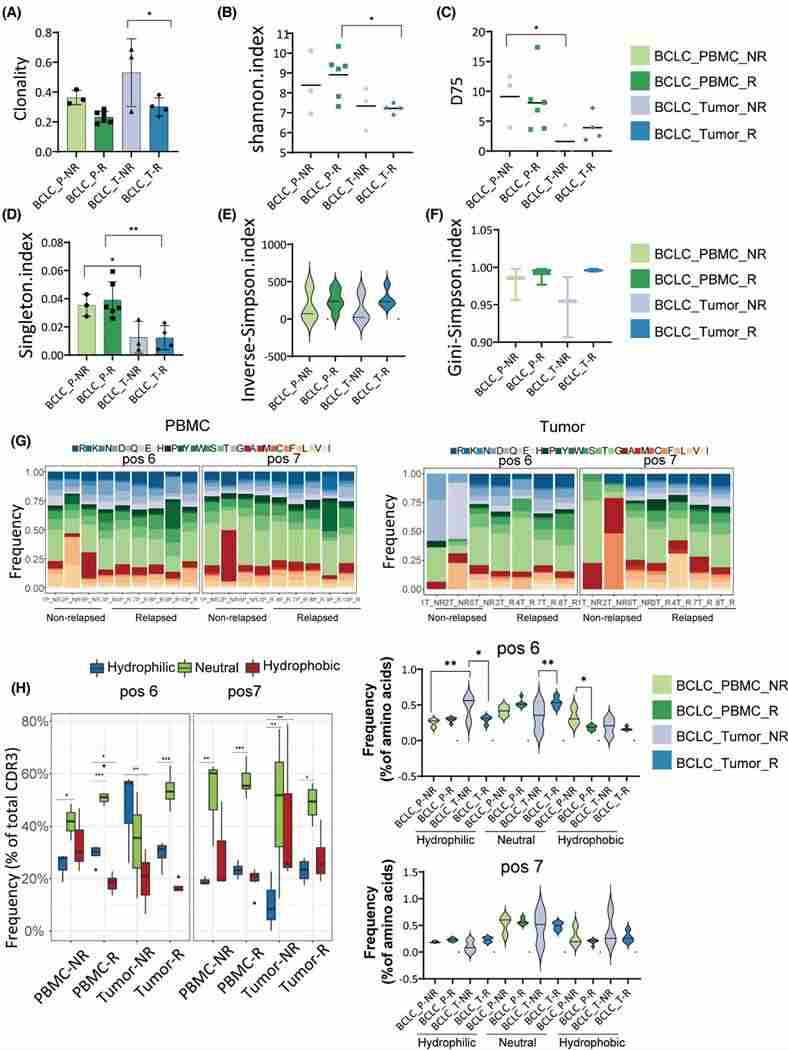 Figure 5. Clonality and diversity analysis in relapsed and non-relapsed patients. group
Conclusion
The research elucidates the distinct characteristics of T-cell receptor (TCR) sequences across various tissues — including tumor tissues, adjacent non-tumor tissues, and peripheral blood mononuclear cells (PBMCs) — at different stages of the Barcelona Clinic Liver Cancer (BCLC) staging system. A systematic longitudinal analysis of disparate temporal stages, combined with a cross-sectional analysis across diverse samples, reveals the shifting landscape of TCR traits during hepatocellular carcinoma (HCC) progression. Notably, TCR clonality in peripheral blood T-cells demonstrates a significant increase in stage BCLC_C compared to earlier stages, while diversity is markedly diminished. This indicates PBMCs may offer more insightful delineation of TCR traits across differing tumor stages in HCC patients, as compared to tumor tissues. We have clearly outlined a relationship between TCR traits and HCC prognosis; patients exhibiting heightened TCR clonality face lower risks of tumor recurrence, thus leading to improved prognoses. We speculate that the level of TCR clonality within early-stage tissues may be a valuable predictive marker for post-operative recurrence in patients.
Reference:
- Li R, Wang J, Li X, et al. T‐cell receptor sequencing reveals hepatocellular carcinoma immune characteristics according to Barcelona Clinic liver cancer stages within liver tissue and peripheral blood. Cancer Science, 2024, 115(1): 94-108.


